
Rystad Energy has kickstarted its global emissions coverage, gathering key data and ranking the world’s oil and gas producers by how much CO2 is emitted in connection with their upstream activities. The first such report, which the firm expects to publish annually, shows that the US was the largest emitter in absolute terms in 2018. Among the top 10 oil and gas producing countries, Canada had the highest CO2 emission intensity per barrel of oil equivalent (boe) produced, while Norway had the lowest.
For 2018, the year with the latest reliable data, the US was the world’s top emitter from upstream oil and gas producing activities in absolute terms, releasing a total of 133 million tons of CO2, followed by Russia (116 million tons) and Canada (114 million tons) (Fig. 1).
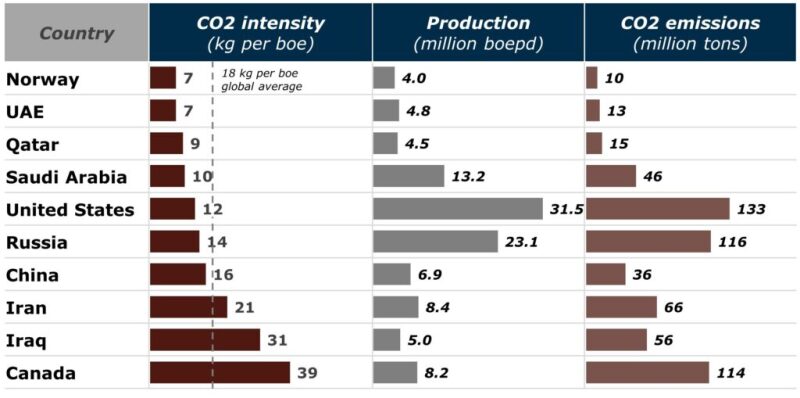
Fig. 1—Upstream carbon dioxide emissions for the top 10
oil and gas producing nations in 2018
ranked by carbon dioxide intensity, production,
and absolute emissions.
When it comes to CO2 intensity per produced boe, Norway shows the lowest upstream CO2 footprint among the top 10 producing countries, with approximately 7 kg of CO2 per boe produced. Norway introduced a CO2 pricing mechanism in the early 1990s, while also adhering to the EU carbon trading system, which has motivated operators in the country to put extra emphasis on emission-reducing measures and technologies.
Several major Norwegian offshore fields, such as the giant Johan Sverdrup project, are now partly or fully electrified by power from shore, thus reducing CO2 extraction emissions substantially—even approaching zero in some instances. Furthermore, gas flaring has been banned in the country since the 1970s, with certain exceptions for safety purposes, which has resulted in a very low flaring intensity.
The UAE, Qatar, and Saudi Arabia are challenging Norway for the top position in terms of CO2 intensity, each with emissions at or below 10 kg per boe. Saudi Arabia and the UAE benefit from large field developments with stable production levels and limited flaring, all of which contribute to low emission intensities. Moreover, production in these countries is dominated by light- and medium-grade crudes, which are less energy-intensive to extract compared with heavier oils.
At the other end of the scale, Canada and Iraq are both among the world’s highest upstream emitters, albeit for different reasons.
Canada, with an average intensity of 39 kg per boe, has a high share of its production from oilsands, typically emitting three to five times more CO2 per barrel than the global average of 18 kg per boe. Heavy oil produced by mining or thermal in-situ extraction is more complicated to extract, and the process is very energy-intensive. In recent years, several major producers have divested their assets in these segments because of the expensive extraction process and the high carbon footprint.
Iraq, on the other hand, with an intensity of 31 kg per boe, has relatively low extraction emissions. However, the lack of gas infrastructure in the country means that significant volumes of associated gas are flared directly. The country must, in fact, import gas in order to meet its energy requirements. An expansion of Iraq’s domestic gas infrastructure would allow it to reduce flaring and imports, but such plans have yet to materialize.
“The average upstream CO2 emission intensity of oil and gas production worldwide was about 18 kg per boe in 2018, but the variation between producers is high, both in terms of countries and companies,” said Jon Erik Remme, Rystad Energy senior upstream analyst. “Between individual fields, the variation is even higher.”
The amount of flaring served as a key distinguisher leading to a difference of 23 kg per boe observed between the highest and the lowest intensities in the analysis. In addition to flaring, the inherent differences in extraction emissions driven by the method of extraction, the field type, age of the field, and other factors collectively yielded a difference of approximately 30 kg per boe between the highest and the lowest intensities.