Whiting Petroleum has made an extraordinary commitment to rock testing. In its office tower in downtown Denver, its digital rock imaging laboratory analyzes about 6,000 ft of core samples each year, examining details down to pores only a few nanometers across.
When evaluating new plays, or considering alternative plans for its proven fields, the independent oil company uses a battery of imaging devices. The common question faced is: “Is it going to work?” said Lyn Canter, a senior geoscience adviser who manages the laboratory at Whiting.
She has been asked the same question by other companies considering whether there is a return for investing in in-house rock imaging. Her answer is: “We think it gives us a competitive edge” by providing timely answers to questions raised by complex tight oil formations, many in the Niobrara and the Bakken, that cannot be answered using routine core testing methods.
One example of its value was that Whiting decided not to go forward with a costly proposed field development project after rock tests indicated it was not permeable enough to support profitable production, Canter said. While she said the equipment has paid for itself at Whiting, it represents an unusual level of support, which would be difficult for others to replicate.
Service companies see growing interest in digital rock testing, but few companies regularly use digital imaging as a reservoir analysis tool, and only a couple of majors in the United States have their own in-house equipment, Canter said.
Woodford Views |
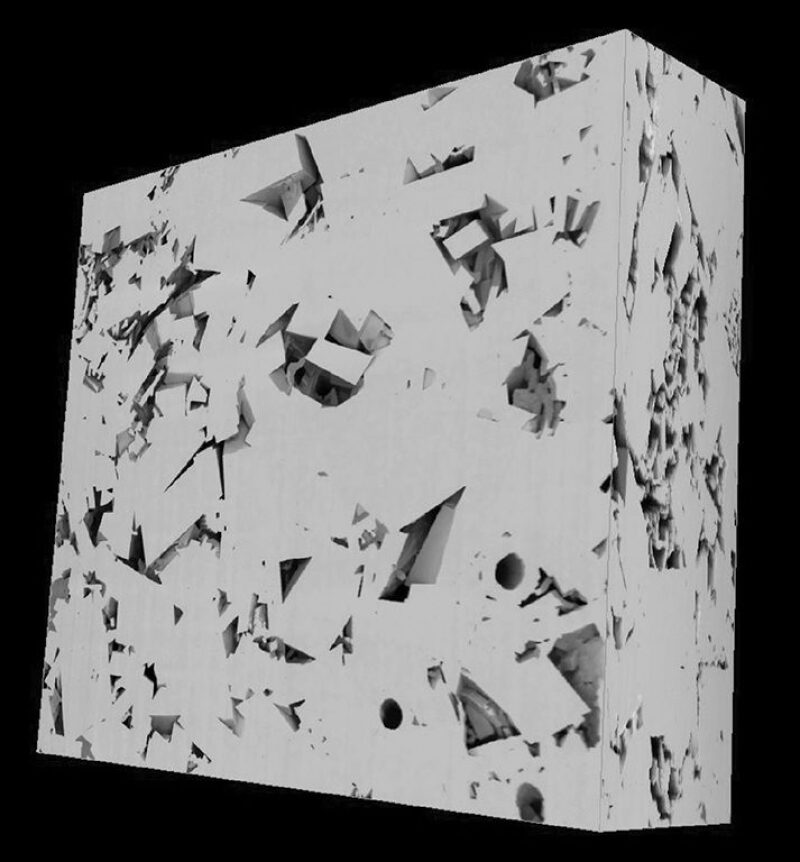
Rock samples from the Woodford Shale provided by Devon Energy were imaged using a scanning electron microscope. It shows the wide range of details in samples ranging from 5 microns to 300 microns wide. Courtesy of FEI and the University of Oklahoma. |

Slit like pores are surrounded by glauconite. Such elongated pores will often close after production begins, which reduces permeability. Also, glauconite is water wet, making it likely to swell when exposed to water, further reducing the flow of hydrocarbons. |

A world of details is packed into a sample 5 microns wide featuring minerals and organic matter found in the Woodford Shale. There are dark gray pores with organic material inside: the pyrite is white, and clays, quartz, and possibly feldspar are medium gray. |

The dark blobs are the organic matter found in algal cysts. These ancient remains are significant for two reasons: Under the right conditions they can mature into hydrocarbons and the mineral content associated with them can affect how the rock responds to hydraulic fracturing. |
The complex texture is due to bioturbation—disruption of the original sediments by organisms—that can alter the mechanical properties of the rock. Darker-colored organic material is seen among small grains of quartz. The larger grains are dolomite crystals, and the white spots are pyrite. |
Generating credible results likely to influence decision makers has required a significant, long-term commitment of equipment, skilled personnel, and the time needed to develop the workflows for generating results that exploration teams will use. This requires selecting representative samples, as small as a grain of sand, to image the pore-scale details from complex rocks with features that are consistently inconsistent.
The tools and processes needed to turn observations of the rock microstructure into measurements is an emerging technology. As a result, engineers are the ones asking the toughest questions about the results, she said.
“We want engineering to buy in to what we are doing,” Canter said, adding, “They are naturally skeptical, but can be convinced by making a good case that the results offer a view of the average properties of the larger reservoir.”
The motivation for all this effort is that conventional core testing, which was developed for rocks with features on a far larger scale than shale, fails to reliably answer important questions raised by these fine-grained rocks. Frequently put at the top of the list: Is the oil in the rock “movable?”
“Measuring oil in place is easy. It is mobility that is hard to determine. Can we expect any oil production from shale?” Canter said. The answer requires creating 3D digital images of the passageways with these ultratight rocks and analyzing if any or all of the oil molecules present can move through them
“Exploration teams will believe porosity” readings from routine core analysis, Canter said. “But hardly anyone accepts permeability measurements.”
The images offer amazing details, showing features so small that they can only be seen with the aid of the most powerful scanning electron microscope (SEM), but the samples imaged are only 20 to 30 microns across, or 0.02 to 0.03 mm.
Technology development and research in the field is aimed at bridging that gap. A new automated system allows Whiting to create a 1-in.-square image made of more than 500 2D SEM images in half a day. Larger images help ensure that when Whiting’s lab picks spots for the 3D imaging, they are representative. Recently acquired instruments are also designed to overlay different data types from multiple instruments.
The sampling and analysis still require decisions by the lab staff and members of the exploration teams concerning questions, such as whether a break is a natural fracture that would allow oil to flow, or a break created when it was sampled or shipped. None of the interpretation is automated. “We have to make determinations on a zone-by-zone basis,” Canter said.
Scaling up results from microscopic analysis for use in field work relies on the skill and judgement of lab staffers and exploration teams. There is work to be done to convince the industry these numbers can be dependably manufactured, and do so more efficiently.
While there are a lot of skeptics, digital imaging has been a growing line of business for service providers. Weatherford Laboratories has seen rapidly rising demand for digital rock imaging over the past 3 years, said Michael Dixon, manager of geologic services at Weatherford Laboratories in Houston.
“We want to improve our ability to upscale data,” he said. “Everyone wants to be sure that the properties seen in the sample analyzed are representative of the reservoir as a whole.”
Rock Diagnostics
Multiple machines are required to examine rock on multiple scales. Widely used microscopic imaging methods that are known by acronyms—CT for computerized tomography, FIB-SEM for focused ion beam scanning electron microscope—are combined with chemical and standard core tests.
Early adopters of these tools spoke at a recent workshop: Future Directions in Shale Reseach and Digital Rock Analysis. The session was part of a technology development collaboration by FEI, a maker of scanning electron microscopes, and the University of Oklahoma’s Mewbourne College of Earth and Energy. The company’s goal is to foster the widespread use of this sort of equipment, as seen in semiconductor making, a major market for FEI.
Study of Unconventional Rocks |
| The study of unconventional rocks requires creating new tools. Often these are things that have been previously used in other sectors and adapted for use in exploration and production: |
|
For the university, it adds the latest equipment from FEI to image the rocks and create large-area mosaics from multiple high-resolution images, which can be cross-referenced to the localized chemical analysis. The facility fills several rooms on a floor where laboratories use a growing range of equipment to study how unconventional rocks work. The goal is to identify details “on the nanoscale that define the properties of a sweet spot,” said Carl Sondergeld, a professor at the University of Oklahoma (OU) Mewbourne School of Petroleum and Geological Engineering who played a leading role in building industry-supported shale research programs along with Professor Chandra Rai.
The role of these new testing methods is evolving. At Whiting the growth of digital rock analysis has not led to reductions in other sorts of testing. “You need to do a whole spectrum of tests,” Canter said. “One does not replace the others.”
What was once a research tool used to discover the source of oil and gas in unconventional rocks is starting to be used by the industry. “Some use it in a post-mortem way. They want to understand what happened. What is different about this well?” said Dixon. Others “working in a new area want to get some science done early so it can be compared to other experiences.”
Companies are looking at digital rock analysis as a way to improve its results. A Cimarex Energy geoscientist talked at the workshop about using imaging to understand why seemingly similar wells, based on well logs showing comparable porosity and organic content in an unconventional formation, produced vastly different results.
The 3D image created by a FIB-SEM showed the rock in the disappointing well offered less “connected porosity,” which limited the flow of fluids in the pores, said Mike Miller, chief petrophysicist at Cimarex.
The company is now working on finding ways to expand its use beyond unraveling puzzles to systematically improving the performance of its projects. Conventional exploration tools were used to lock up good acreage, but the goal is to find new methods that can promote better development decisions within those large areas. “We bought a lot of good acreage on that basis. But it is not what we need to do to pick locations for wells and depths for laterals” in deep formations with multiple zones to choose from.
Advanced Rock Testing On the Line of Death |
In northeastern Pennsylvania, advanced rock testing helped make the case for a chemical test created to determine if a well was located on the wrong side of the “line of death.” The line is an ill-defined boundary of the Marcellus Shale, where the risk of a dry hole rises markedly and conventional core analysis does not show why some wells produce and others do not. In a presentation at the workshop, Christopher Laughrey, senior geosciences adviser at Weatherford Laboratories, described a project backed by several operators to find whether a geochemical test can predict which wells will be productive when completed. The goal is to avoid the high cost of completing bad wells. Chemical analysis of the gas produced during drilling identified differences in what came out of the good and the bad wells. “The gas isotope data were able to predict outcomes of the fracturing job along the line of death,” Laughrey said. The results suggested an operator could save millions of dollars by not completing wells based on chemical fingerprinting, but he wanted direct evidence of the apparent connection. Pore-scale imaging showed the unproductive wells predicted by the isotope analysis contained clearly altered organic matter. When 3D models of samples from those wells were done by Weatherford using an FIB-SEM, they showed the samples did not have the interconnected pore network needed for gas production. Data gathering continues to test the hypothesis. |
New rock testing methods are being added and old methods are being re-evaluated. “It is a learning process,” Sondergeld said. When it comes to understanding these formations, a big question is “what do we need to measure?”
Another challenge is creating working models predicting the flow through shale. It is difficult because the passages in these fine-grained rocks come in many forms and are so tiny the normal physical descriptions of fluid and gas flows do not apply. Researchers like Sondergeld want to under the physics of flow through shale well enough to create digital rock models able to predict performance.
Digital rock development goes back decades for conventional rocks. Mark Knackstedt, director of technology development at FEI Lithicon, is a pioneer in the field, beginning with digital rock models for porous sandstones, and then carbonates. Now the former Australia National University Professor is working on analyzing the rock in a tight gas formation.
These low-permeability tight gas rocks can present as many as five different pore types within a volume the size of a cubic millimeter, he said. Still, they are not as puzzling as shale where pores of nanometer-scale are encountered. When it comes to shale he said: “There is a problem of capturing the correct physics of flow.”
There is also digital rock work being done below the surface. Dixon said Weatherford is getting requests from major oil companies for specific tests with little explanation of the purpose. Some simply ask for images and data sets, said Kultaransingh (Bobby) Hooghan, who does FIB-SEM analysis for Weatherford Laboratories.
While there is a lot of attention on upscaling the results from small sample tests, there is also work that could be described as downscaling. The goal is to see if the interpretations from widely used tests, such as well logs, reflect the properties of unconventional rocks and to look for new markers of performance in tests covering large areas.
Step by Step From Core to Pores |
| Digital rock analysis requires a system for characterizing large samples of rocks to pick representative small bits for microscopic analysis. This offers an overview of the steps developed by Weatherford Laboratories and Shell to do so. For more, see the paper SPE 166065. |


|
|

|
|
|
Courtesy of Weatherford Laboratories.
|
Imaging down to a microscopic scale provides a look at what logs are highlighting. “It is not like the old days when you could see features (on a core) that show up in the logs,” Miller said.
He reminded the workshop audience that properties measured, such as resistivity to an electric current, may not “measure the things we really need to know.” A log indicating high resistivity, which can be an indicator of oil present, may only point to solid organic material in the rock pores, which resists an electrical current but will not produce oil or gas.
Organic Matter Three Ways |
A close look at the microstructure of shale can show if the organic material inside is likely to produce oil, gas, or nothing at all. Sometimes what is observed, though, does not appear to follow the geologic timeline for when organic material is supposed to thermally mature into oil and then natural gas. Courtesy of FEI and the University of Oklahoma. |
Across the middle of this Bakken sample is a fracture that may have been caused by the generation of oil. Such breaks are often caused by an increase in volume as a solid turns into a liquid in a confined space. |

The dark pores seen with the organic material are often associated with natural gas formations. This rock comes from the Wolfcamp formation in the Permian Basin, which is in the oil window and is not thought to be thermally mature enough to be producing natural gas, raising questions about the origin of the pores. |
This rock from an oil-producing section of the Woodford Shale in Oklahoma does not show the breaks in the organic matter typically found in such areas. This may indicate the oil formed there is stored elsewhere. |
Early Days
Mark Curtis, a research fellow who heads the SEM imaging operation at OU’s Mewbourne School of Petroleum and Geological Engineering, said one of its goals is imaging a “blip.” The blip in this case would be about a 1-ft-long section of rock from a core sample, which could be compared to well logs to get a better idea of what they are “seeing” in that rock.
That goal is within reach because of a tool that has been around for about a year. FEI’s modular assisted processing system (MAPS) automates the process of scanning and combining images. Larger image creation systems are a trend in this business, with Zeiss offering a program called Atlas.
These systems represent a big advance from the days when an OU student spent weeks combining a handful of images. Now, one picture made from tens of thousands of images can be created in 5 days using an automated process that scans the images and puts together a seamless mosaic. The OU-FEI collaboration has shot about 250,00 SEM images used to assemble wide-area images of up to 25,000 high-resolution 2D images, most from the Barnett Shale and the Wolfcamp in the Permian Basin, said Eric Goergen, an FEI senior applications engineer assigned to the collaboration with the University of Oklahoma.
“We are still in the early days,” said Don Kania, chief executive officer of FEI. While shale research led to more industry use of the high-end machines required to see the features in a shale, there is still “no killer app,” one that makes SEM testing a must
Weatherford chooses spots for SEM imaging using a mosaic made of images from an optical microscope, which Hooghan said can be created in far less time than a wide-area SEM image.
One barrier to its use is that the machines are costly devices designed for scientific work, which needs to be run by “true professionals,” said Knackstedt of FEI Lithicon. For example, Curtis of OU holds a PhD in physics and his second-in-command has a similar background.
The staff of six in the Whiting lab includes five PhDs, with expertise in sedimentology, rock physics, computational biology, geology, and a SEM engineer with experience in semiconductor making. Canter said the growth of rock imaging will require universities with active rock imaging programs to train students in these techniques.
One of FEI’s goals is development of specialized, easier-to-use devices tailored to the needs of the industry. When Kania was asked if FEI would produce such a design for exploration and production, he said that it would require a better idea of what it would need to do. “The question is what capabilities would you want integrated?” Kania said, adding, “There are a lot of things that can be done based on the laws of physics, but it is limited by the laws of economics.”