Produced-water reinjection (PWRI) is an important strategy for deriving value from waste water, but its implementation can face challenges related to injectivity and safety issues. The first objective of a PWRI-design study is to supply water-quality specifications, and the second is to supply injection-pressure specifications. The objective of this paper is to detail how water quality and injection pressure are deduced when uncertainties of input data are considered.
Introduction
Before any PWRI design commences, a feasibility study is performed to assess any compatibility issues and evaluate the risk of scaling and souring and the viability of the project. Bacteria growth and corrosion of the installations have to be tackled and mitigated upstream in the early phase of the project.
The first objective of a PWRI-design study is to determine the water quality in terms of optimum total-suspended-solid (TSS) and oil-in-water (OIW) contents, which could remain in the water after treatment and which would enable maintaining the injectivity under PWRI during the field life. These two parameters allow design of the water-treatment installations. The second objective is to determine the pressure needed to achieve PWRI sustainability; the pump power and the injection-network size will be designed on the basis of this pressure.
PWRI-Design Approaches
There are three main approaches to PWRI design. The first approach is based on analogs and correlation laws, the second is based on laboratory experiments, and the third uses simulations with predictive models. Of these, the most effective is that of running simulations with predictive models, because this allows simultaneous determination of the water quality and the injection pressure needed to sustain injectivity.
Field evidence indicates that, whatever the quality of produced waters, PWRI in matrix (or radial injection) regimes inexorably leads to a continuous decline of injectivity. PWRI is viable only in a fractured regime, and pressure and water quality have to be designed for long-term efficiency of this regime. Fractured injection, though a complex process to model, is now considered to be a part of the PWRI strategy for field developments.
New PWRI simulators are based on modules describing the flow in both matrix and fractured regimes coupled with a module describing the plugging inside and around the well, as well as plugging within and around the fracture, if any. Compared with conventional fracture software used for stimulation jobs, the fracture module takes into account the thermal and poroelastic effects generated by the high leakoff of cool water.
PWRI-Modeling Approach
The model proposed is semianalytical, with a flow module that simulates matrix and thermal fractured injection at constant flow rate or pressure. It allows calculating the bottomhole flowing temperature by use of a transient-heat-exchange solution between the well and the Earth. The flow is considered to take place in three successive zones: a cooled zone, a flooded zone where injected water is warmed up to reservoir temperature, and the undisturbed virgin reservoir.
The plugging module enables calculation of the pressure excess generated by the deposition of solid particles and by the oil in suspension contained in the produced water. It simulates the damage occurring during the radial and fractured phases. Two damage mechanisms are considered in each injection phase. The first corresponds to the permeability decrease resulting from the deep invasion of the reservoir by the water contaminants. The second describes the filter cake, which deposits either on the wellbore face during the matrix injection or inside the fracture during the fracturing phase. The transition time from the deep damage to the external damage is also taken into account.
The present code offers two options to deal with the internal damage, which is governed mainly by oil-droplet migration and deposition rather than solid particles. The first option considers that internal plugging would extend deeply into the reservoir. It is called the deep-invasion model and supposes that oil droplets would invade deep into the reservoir. The second option considers that the internal damage would extend only a short distance into the reservoir from the wellbore. It is called the shallow-invasion model (SIM) and considers that all oil droplets will deposit close to the well or close to the fracture faces, saturating the pore space completely (oil bank).
In a first geometry, the cake is considered to deposit uniformly on the fracture faces. It is called the face-cake model (FCM). In a second geometry, the deposition of the cake is supposed to occur only at the fracture tip. It is called the tip-cake model. After calculating the distribution of the cake in the fracture by material balance, the code calculates pressure excess generated by the reduction in the net fracture length and the cake deposition as well as the friction resulting from -fracture-width reduction. It updates the bottomhole injection pressure and the stress and repropagates the fracture. The code calculates when the fracture is completely filled with cake.
The maximum injection pressure, which must not be exceeded during PWRI to avoid caprock failure and out-of-zone injection, is not calculated automatically by the code, as is the case with 3D codes. The maximum pressure is imposed as an input parameter and fixed by the user. It corresponds to the minimum horizontal stress of the caprock. This scenario is quite conservative, but minimizes the risk of caprock failure.
Uncertainty-Assessment Approach
The tools used in this study belong to the domain of experimental design: screening, modeling, and Monte Carlo simulation. In the case of reservoir engineering, the approach is dynamic flow simulation with numerical models. Because the PWRI simulator used here requires little memory, a large number of experiments are used for reliable statistics.
A screening uses a simplified design with no center point (i.e., parameters taken only to minimum or maximum levels). The objective is to rank the respective impact of parameters and retain only the most influential. Most common screening designs include the fractional factorial design for up to 32 parameters and the Plackett-Burman design for up to 99 parameters.
The modeling phase consists of a more-complex design that may be either geometric, in which case the parameters include a center point (i.e., all parameters at their median value) for generating an interpolated response surface in the multidimensional parameter space, or a space-filling design, mostly used for sampling a multidimensional space. The response surface may be any mathematical equation fitting the data. In most cases, a second-order polynomial equation is sufficient to fit responses with a high likelihood of predictability.
A third (optional) step, Monte Carlo simulation, uses the response-surface equation to generate quickly a large number of estimated responses on which it is possible to fit a common distribution, extract quantiles with their associated combinations of parameter values, and from there run more experiments to validate estimations.
Results and Discussion
Screening Phase. The purpose of this phase is to isolate among the 54 input parameters those with greatest influence on PWRI design, a matter of quantifying the average impact of each input parameter and ranking them. The screening is made by considering only 36 parameters among the 54 needed for PWRI forecast and design. The PWRI example was deliberately chosen to represent a reservoir buried and warm enough to develop thermal fracturing. A factorial design was made with 80 experiments (Plackett-Burman design) to ascertain the impact of the 36 data on the forecasted or output parameters. The SIM model was selected for internal damage, and the FCM model chosen for the cake buildup within the fracture.
Among the 36 parameters considered as uncertain, only 11 have a significant effect on the bottomhole-flowing-pressure forecast during PWRI. The most influential parameters in pressure simulation are in descending order the reservoir thickness, the thermal-expansion coefficient, and the TSS content.
The rank changes when the effect of parameter variation is considered regarding the thermal-fracture half-length. In this case, the most influential parameters are in descending order the -thermal-expansion coefficient, the reservoir temperature, and the Young’s modulus. The fracture half-length is mainly influenced by rock mechanics and thermal parameters.
For a discussion of the modeling phase, which was performed to deduce the optimum water quality for PWRI during the life of a field without exceeding the safe maximum pressure and without completely filling the fracture, please see the complete paper.
Case Study. The field in question is currently in production, and the water-treatment facilities are already available and deliver a certain water quality. The purpose is to verify if the principle of uncertainty evaluation proposed here would have been able to give the injection pressure needed to make this pilot successful under a fracturing regime.
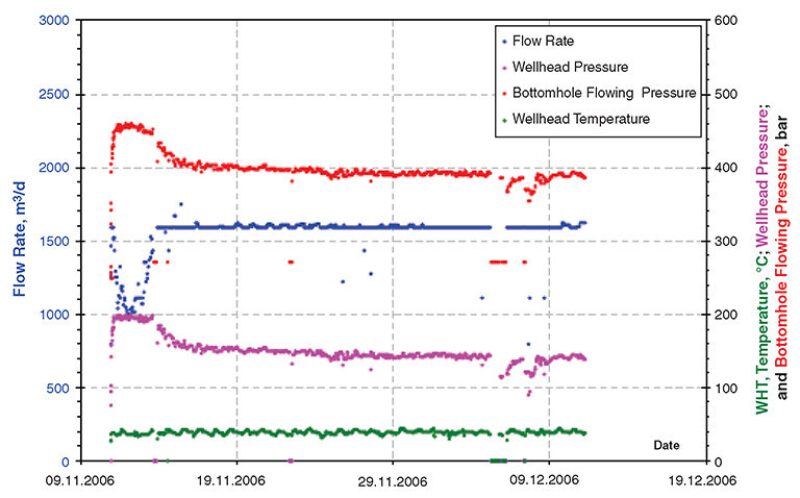
The pilot well is cased and perforated and injects at 2700-m true vertical depth in a sandstone reservoir of approximately 15.5 m delimited above and below by impermeable shale and coal layers. The injection history is given in Fig. 1 and shows that the target flow rate was approximately 10,000 BWPD and that the fracturing regime initiated at a wellhead pressure of approximately 200 bar. The water quality, in terms of TSS, OIW, and temperature, was monitored closely. Two water samples were analyzed every day during the 1-month pilot duration.
Two thousand simulations were performed with the 16 uncertain-parameter distributions. The FCM was considered for the cake-buildup mechanism within the fracture, and the SIM was considered for the internal damage.
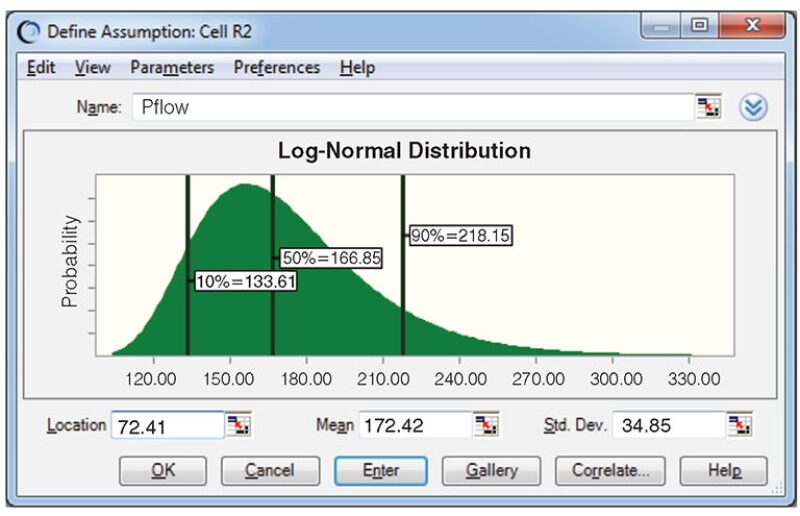
The wellhead-pressure (WHP) distribution from the 2,000 simulations is given in Fig. 2. It shows that a wellhead pressure between 134 bar (P10) and 218 bar (P90) has to be planned to make the pilot successful during the month of injection with the available water quality. If the proposed uncertainty approach had been used, the design pressure chosen would have been the P90 (218 bar), which is close to the WHP of 200 bar actually applied during the pilot. The P50 of the pressure (approximately 167 bar) would have been insufficient to fracture the reservoir and to maintain the injectivity.
The distribution of the fracture-initiation time was also obtained and shows that the fracture would have been initiated between 1.87 and 3.37 days of injection. This is in line with the real fracture initiation observed during the pilot (i.e., approximately 2 days).
The distribution of the fracture half-length obtained from simulation shows a value between 36 and 41 m at the end of the pilot-injection duration.
This article, written by JPT Technology Editor Chris Carpenter, contains highlights of paper SPE 165138, “Produced-Water-Reinjection Design and Uncertainty Assessment,” by Jalel Ochi, Dominique Dexheimer, and Vincent Corpel, Total EP France, prepared for the 2013 SPE European Formation Damage Conference and Exhibition, Noordwijk, the Netherlands, 5–7 June. The paper has not been peer reviewed.