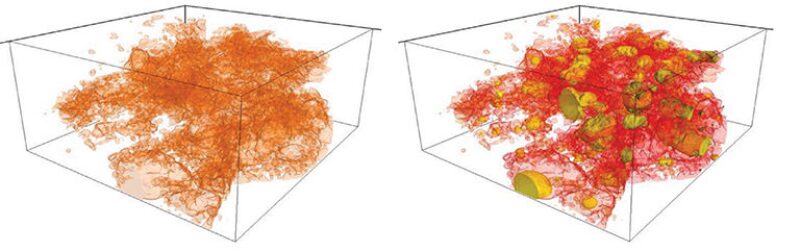
Researchers are creating simulations to try to understand how oil is produced from networks of pores too small to observe. In this video from EP Energy, falling pressure allows natural gas trapped in the oil (orange) to bubble out. The free gas (yellow) expands and expels the oil (red). Pores connect and free oil and gas concentrate in spots (greenish), Production ends when the gas stops escaping.
The story of unconventional oil and gas technology development has been focused on fractures. The formula has been more stages, more sand, and more water, targeting the most productive spots.
The trend continues, with rising production and larger completions at a time when the oil price bust has slashed the cost of services and supplies. Even so, production from unconventional wells leaves 90% of the oil in the ground, raising the question, what is next?
Some have taken on the daunting task of trying to understand how oil and gas flows out of the tiny pores in ultratight rock that feed the fractures flowing to the well.
Compared to what it takes to effectively fracture rock and target sweet spots, the science behind fluid and gas flows through pore networks is a difficult slog deep into the unknown. It is a frustrating search, but that is where the oil is.
“The first part of the problem is that people started to say that oil and gas is stored in the fractures and that by fracturing a well you are simply exploiting that storage event,” said Richard MacDonald, the innovation, strategy and execution manager for EP Energy, which is among the companies looking deeper (Fig. 1). “We calculated what fractures will hold and that volume will last only a week or week-and-a-half of production. After 2 weeks, where is the oil from? The matrix.”
The matrix is a frontier, like the unexplored lands shown in maps made centuries ago during the era of exploration when those vast uncharted spaces spawned fantastic tales. These explorers are looking at explanations for production patterns that diverge from what they know.
“It is not something they taught us in school,” said Steve Jones, reservoir engineering advisor for Cimarex. “We are learning, figuring out what are the facts of life and the ground rules, the theory.”
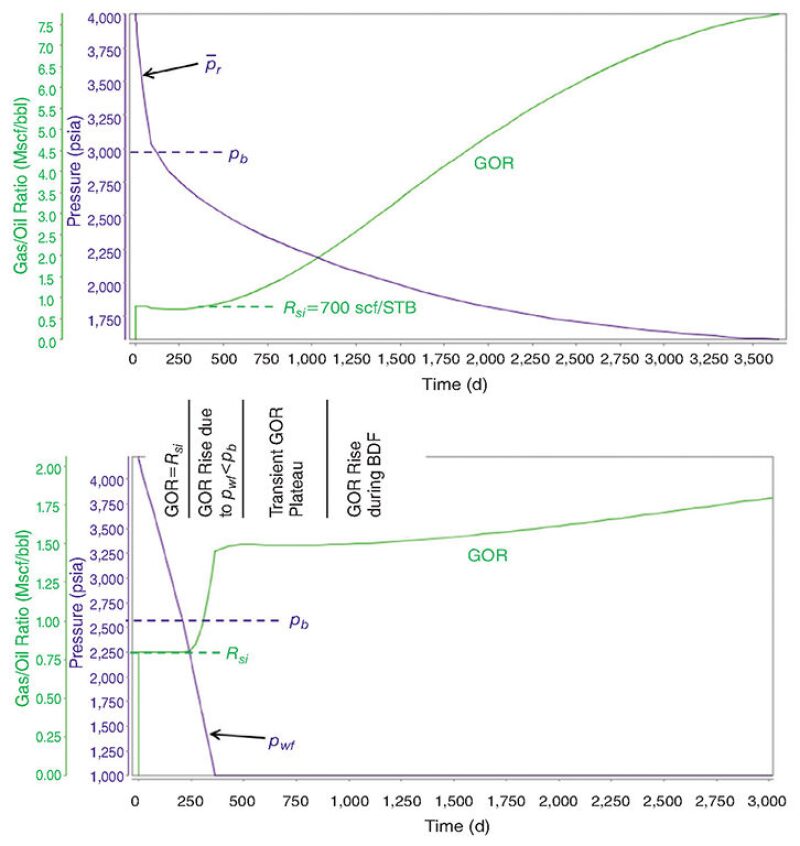
Based on his experience at Newfield Exploration, he delivered a technical paper at the recent Unconventional Resources Technology Conference (URTEC 2460396) explaining why changes in the gas/oil ratio (GOR) produced from certain unconventional wells, which would be alarming in a conventional field, are the norm in the unconventional plays he saw in Oklahoma (Fig. 2).
Jones is among those working on field-scale problems. Others are doing pore-scale studies on this ultratight rock where standard terms such as reservoir and transient seem an odd fit based on the established definitions.
While an online dictionary defines a reservoir as a place where fluid collects, especially in rock strata, it offers a poor mental image of unconventional rock. There the oil in the rocks is scattered throughout pore networks with openings ranging in size from a large virus down to just a bit bigger than a DNA molecule. Spaces at the low end of the range are so confined they can alter the physical properties that control production, particularly the bubblepoint—the pressure at which the gas in oil escapes from the liquid.
The definition of transient is a good fit for the rapid pressure changes that can occur in a conventional reservoir. But in the ultratight rock of an unconventional reservoir, this transient state is the opposite of fleeting. It can last decades and span the productive life of the well.
“The difference is that in a higher--permeability (conventional) reservoir, the pressure is the same throughout the reservoir at any given time. It will take a few days for the pressure to stabilize a quarter-mile from the well,” Jones said. “In real tight reservoirs, it takes months or even years for the pressure wave to get out even 100 feet.”
Understanding how things work at pore scale is also a slow-moving process. Jones’ paper drew on the work of Chris Clarkson, a professor at the University of Calgary, who has written a series of papers in recent years about practical applications in developing unconventional wells.
“What are the fundamental controls on flow and fluid storage in these rocks? We have a lot to learn,” Clarkson said, adding: “Our research group is trying to do this, and importantly, to marry field observations with experimental observations and theoretical studies.”
The task is doubly difficult because these plays are so inconsistent. Production decline rates have been described as “decays in random disordered, chaotic, heterogeneous systems,” in the work of two petroleum engineering professors at Texas A&M University, Peter Valkó and Tom Blasingame.
The phrase is an apt definition for widely varying formations. For example, a presentation by Blasingame offered three models of flow with equations mixing a traditional one for permeable spaces (Darcy) with ones used to describe diffusion (Knudsen and Klinkenberg). The formulas are evolving as more is learned.
“They need models supported by lab experiments,” said Deepak Devegowda, an associate professor of petroleum engineering at the University of Oklahoma, who has studied flow equations as part of his work on modeling. “I think there is value. That value will be realized a few years down the line.”
Looking Deeper
While academic researchers grapple with questions that could easily span a career, exploration and production teams in companies such as EP Energy need to identify ideas that can pay off in the near term. After years of slashing costs, the best option for producing more is to apply brainpower to find ways to get more oil out of the ground. When drilling was booming, it made economic sense to vary how wells were drilled and completed to see which changes correlated to better results.
But the drilling boom has passed and is not expected to return soon. Com-panies such as EP are turning to digital tools to test designs and ideas on a limited budget, whether it is for a completion or a research project.
Initially, EP used statistics-based analy-sis from its drilling and deductive reasoning to understand how incremental improvements in well placement or fracturing designs correlated to well productivity. Now, with less drilling data to feed into analytics programs, it is looking for bigger gains through a better understanding of the physics that govern the flow of oil at the nanoscale pore to identify the cause
of things.
“At USD 100/bbl, price correlation works; at USD 40/bbl, causality is needed,” said Steve Geetan, geoscience advisor for EP Energy.
Proving that requires a digital simulator for experiments that show the dynamic behavior of fluids in nanopores. Digital testing offers a way to learn quicker, fail cheaper, and identify which working hypotheses are worth a field test.
Since no simulator was readily available, the company developed its own in a process described in a recent technical paper (URTEC 2461115). It already had 3D microscale models of rock samples from one of the company’s unconventional wells on hand, showing a maze of pores that looked like capillaries circulating blood. But a way to simulate how gas and fluids behave when interacting within those constricted passages was lacking. There are many variables to consider.
- There are different pore types—organic pores holding kerogen that can produce oil and gas, and inorganic ones holding gas, oil, or water.
- The chemistry of the pore walls differs. Organic pore walls are thought to attract oil (oil-wet) while inorganic ones attract water (water-wet).
- The passages include a range of shapes and sizes with many spots so tight that quantum mechanics applies.
“Geometry matters. The shape and walls of the pores are dominating how the system behaves,” Geetan said. “The nature and shape of organic and inorganic pores determine what they can hold or what they will release.”
MacDonald and Geetan found a way forward when they met Denis Klemin, a senior digital rock engineer from -Schlumberger’s Moscow Research Center, who coauthored the URTEC paper. After they discussed the problem, Klemin told them he had a way to describe the flow in those confined spaces.
He had an algorithm that could simulate the interactions of liquids and gas in a 3D nanoscale pore network based on density functional theory. To reduce the still considerable computing time required, he wrote code for graphics processing units—processing chips created for demanding computer games and used to speed seismic processing.
The program made it possible for a computer to create animations of how oil is pushed out of a pore when the pressure in a pore drops below the bubblepoint. At that level, gas begins to bubble out of the solution, expands, and replaces an oil molecule that had been securely adsorbed on the pore wall, expelling it from its secure spot and out
of the pore.
“As we lower the pressure in the rock model, the pores ooze a bit of oil. It is minor at best until we hit bubblepoint,” MacDonald said. At that point, gas bubbles out, driving the expulsion process that continues as long as there is gas left in the solution. A higher gas content means greater liquids production.
Modeling showed that the volume of gas grows only as much as necessary to displace the volume of oil expelled. The limited growth in the gas volume maintains the pressure near the bubblepoint as more gas breaks out of the solution.
The simulation work led EP to a hypothesis that the primary source of production from the pore network changes over time, MacDonald said. Early on, when the reservoir pressure is above the bubblepoint, production is primarily draining the inorganic pores. As pressure falls in areas nearest the most conductive fractures, pressure around the organic pores drops below the bubblepoint, gas breaks out of solution, and the expulsion process begins.
The area where expulsion is occurring gradually spreads as the pressure change slowly moves into the ultratight rock. “When one matrix element depletes, it will go to the next one and next one. It is chaining to the next active element,” he said.
As it moves farther, the contribution of oil from the organic pores grows. Production by gas expulsion from an organic pore will have a different GOR than production from inorganic pores, he said.
EP’s technical team has been using the model to study a long list of questions, such as how a rapid pressure change caused by a fracture hit from a nearby well affects production.
“In digital space we can do what-ever we want,” Geetan said. For example, they found it was possible to move water into the pore, if they made certain assumptions. That led to research into the assumptions.
Gathering physical evidence from pores to test widely held assumptions is difficult because these features are so small that the focused ion beam used to slice a clean rock face for imaging by a scanning electron microscope can destroy evidence. During transport, hydrocarbons in the rock can evaporate and microfractures can occur.
The quality of data gathering is critical because “we cannot work that out by waving our hands,” Geetan said.
Curious Relationship
Production analysis is a critical part of this quest because what comes out of the ground is the sum total of multiple effects in these complex, unpredictable formations where different flow factors may cancel each other out.
“Lots of people focus on the really small pore scale,” said Devegowda, who puts himself in that group. “Other people focus on wells and reservoir-scale things. And we have that huge gap in between.”
The work continues because there are unconventional puzzles at the field scale that are a product of what goes on at the pore scale.
One such puzzle is what MacDonald describes as the tale of two wells. It can be seen in long-term production charts. Early on, there is a steep dive in the daily rate. Later on, the output steadies, declining slowly for years at a low level. In between is a noisy transition zone.
“As reservoir engineers, we spend a lot of time on decline curve analysis to predict future performance,” MacDonald said. Projections based on later data required changing the inputs in the equation defining the decline rate and curve. “We can model the front end and the back end pretty good, but we cannot fit both ends into one model.”
Another unconventional puzzle is the changing gas/oil ratio over time compared with conventional reservoirs.
Jones’ paper was motivated by questions he was asked about changes in the GOR over the life of wells in places such as the Meramec play within the STACK formation in Oklahoma. “Management was asking why the gas/oil ratio was acting like it was. They thought it could be a bad thing,” Jones said.
They were troubled because the ratio shot up early in the life of the well. “The gas/oil ratio can be higher in early stages of life than you would expect in a conventional reservoir” where the ratio stays low early on, then later rises at a steady angle, Jones wrote.
The spike in the GOR in unconventional reservoirs is linked to the rapid pressure decline in and around the fractures during early production.
“The steepest change in pressure occurs near the fracture face and this is where the pressure will first drop below the bubblepoint,” Blasingame said.
In that area, the lower pressure allows gas to bubble out of solution, rapidly increasing the amount of gas per barrel of oil produced. This rapid rise ends when production moves into the tight confines of the matrix rock where the rate of pressure change slows to a crawl, and the GOR stabilizes.
Multiple factors contribute to this steady state. One is the fact that the bubblepoint is thought to be lower inside the smallest pores and openings than it would be in a lab test, and that affects production.
This phase shift helps explain how rock thought too tight to produce oil actually does so, according to a 2013 paper by researchers from Colorado School of Mines (SPE 166306). Its simulation showed that in systems with mixed pore sizes, the low bubblepoint in the mid-sized and smaller pores “promotes more oil production while keeping total gas production nearly the same.”
Painstaking laboratory testing has shown that in unconventional rock samples there is a relatively small percentage of spaces small enough to alter the bubblepoint. “Though it [extremely small pores and pore throats] represents only 20% of the storage volume, it is controlling the flow. It is a chokepoint,” -Devegowda said.
But not always. Jones’ paper also included GOR charts from other wells, demonstrating that in unconventional plays “generalizations are hard to come by.” For example, the Bakken and some areas of Eagle Ford do not see this GOR rise until later, he points out.
At the University of North Dakota Energy & Environmental Research Center (EERC), researchers are doing extensive rock testing and laboratory work to create models that bring together all these data to try to explain how pore-scale phase changes affect field performance.
“Phase differences in hydrocarbons can help predict changes in the gas/oil ratio over time,” said James Sorensen, a principal geologist for EERC. “It ripples through operations and how fields are managed on the surface. We are starting to connect those dots between microscale analytic work and what is happening at the reservoir scale.”
Grounded Models
As the North Dakota research center continues to study how to enhance oil recovery in the Bakken formation, makers of reservoir modeling software are paying close attention. The ambitious research program is gathering hard-to-find physical evidence as part of its program to extend the output of wells where production can fall 70% in the first 2 years.
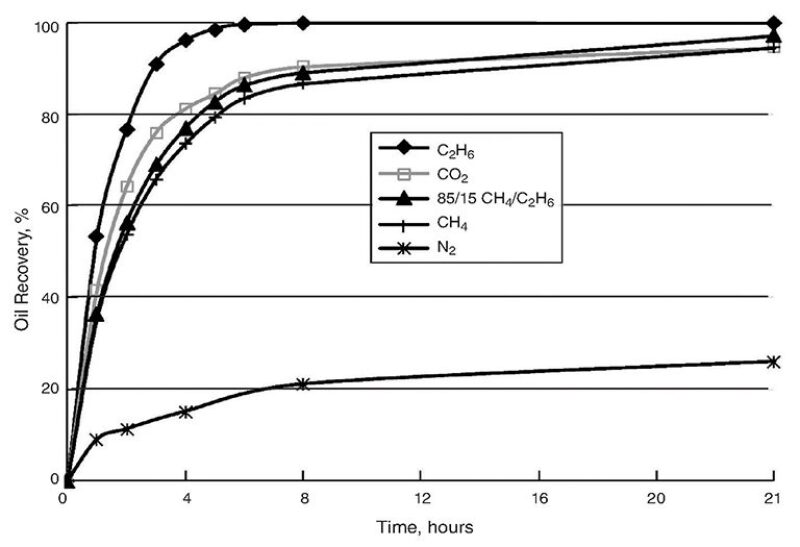
In another technical paper (URTEC 2433692), the center reported on a lab test where more than 90% of the hydrocarbons were extracted from pencil-sized samples from the middle Bakken by bathing them in ethane and methane—singly and together—as well as carbon dioxide. Nitrogen was also tried, but was far less effective.
Ethane was the most effective, which was a positive, because Bakken wells produce a lot of it and the market for it is limited, said Sorensen (Fig. 3). That observation was interesting, he said, because “we expected ethane to do better (than other options) but were surprised at how much better and, in some rocks, it was even better than CO2.”
The center is gathering data and doing simulations to see if it can inject enough gas into the middle Bakken to extract the heavier oil molecules now left behind.
Based on lab testing of core samples provided by companies there, “the pore throats are small but we are seeing a lot of connectivity,” Sorensen said. But in the ground, injected gas is likely to follow the path of least resistance. In past field -trials, it appeared that the gas bypassed the tight matrix rock by traveling through more open fractures.
While North Dakota is studying what happens when gas is injected into a formation, the data are also useful for those trying to create more realistic models of production flowing out of unconventional rock.
Sorenson said the big makers of commercial reservoir simulation software have provided valuable support for EERC’s work to create models to try out its ideas. “We are developing a lot of CO2 permeation rate data and hydrocarbon rate data and are just starting to show that to modelers and having higher-level discussions” on how they can build that into their programs, he said, adding, “It is in the early stages. They say there is value there.”
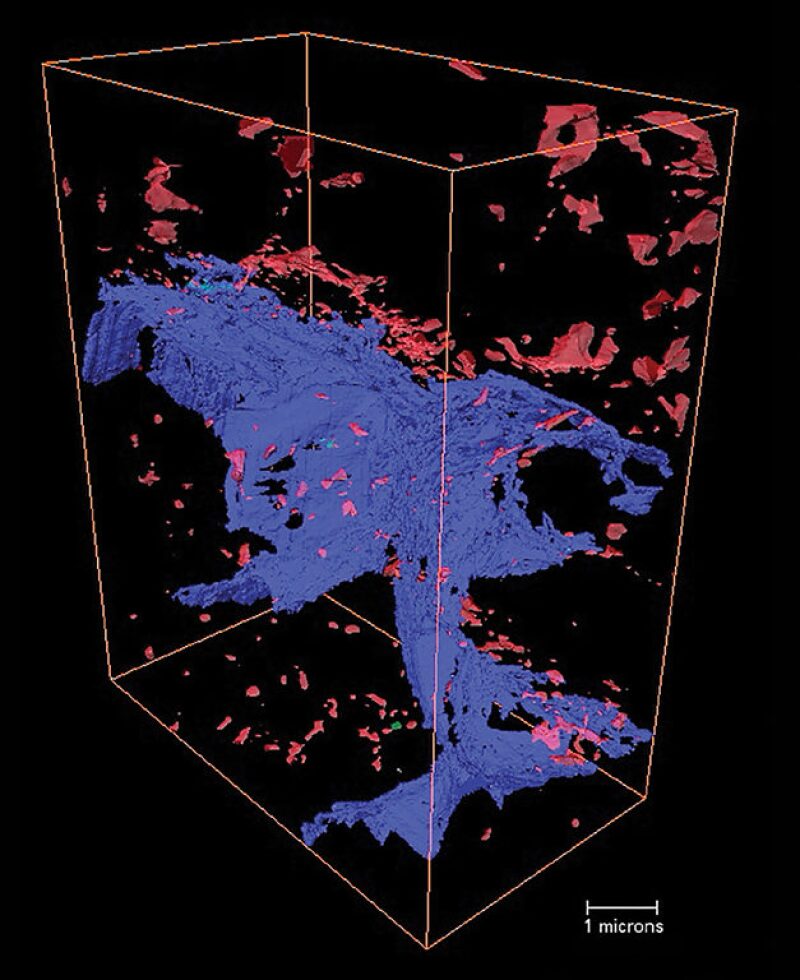
The North Dakota researchers are also working on developing a way to trace the source of production. While most of the oil and gas is from the middle -Bakken, it is thought that the shale in the upper and lower Bakken also contribute where penetrated by fractures (Fig. 4). “If we can demonstrate we can get more from shales, that will change everyone’s reserve estimates and technically recoverable estimates,” Sorensen said.
Flexible Tools
Experience has shown that unconventional plays are unconventional in different ways.
“How different is our Eagle Ford reservoir from our Wolfcamp? It is a lot different. Both are shales and that is kind of where the similarities end,” MacDonald said. As a result, he said, “The more you cannot explain, the more you have to start getting into more specifics.”
While there is no such thing as a uniform reservoir, conventional ones are marvels of consistency compared with unconventional ones. Those common features make it possible to predict future production from far-flung conventional fields using a standard method, such as the Arps equations, whose history dates back to the 1920s.
Arps is often held up as an example of a conventional method that does not work in unconventional plays. Numerical simulation methods could offer a well-by-well analysis, but they are not a practical option for petroleum engineers mass producing produc-
tion projections.
“People are really, really looking for an easy tool to get forecasts,” Devegowda said. “We do not have it. The only thing we can do is fit historical data to some models, which in itself is an assumption.”
The demand is driving a search for new empirical methods, such as the power law exponential and stretched exponential production diagnostics that better reflect the nature of these reservoirs.
“We have people sponsoring our research screaming for these tools that are relatively simple but still rigorous to apply to the hundreds or thousands of wells,” Clarkson said.
“In my view, you are never going to get to the point of forecasting every single well with detailed numerical simulation,” he said. “The data quality does not usually support this level of analysis on many wells, and the models take too long to set up and run.”
What is needed is an array of tools and a data-based method to choose the right one so the prediction is “tied to physical properties of the reservoir or fluids, Clarkson wrote in SPE 172928.
He offered a workflow designed to adapt rate transient analysis to the complexities of an unconventional reservoir where many of the assumptions underlying normal rate transient analysis do not apply.
The degree of differences among unconventional wells means that engineers should consider analyzing clusters of wells with similar properties, he said. The differences are based on the rock and fluid properties within the reservoirs, as well as how it was drilled and completed.
Keeping Quiet
Work by academics stand out in this emerging field because companies are generally not talking about research that could give them a big production edge.
One example of turning pore-level observations into a prediction is a reservoir simulator developed at Texas A&M.
“The incorporation of pore confinement is not available in commercial simulators but may be a significant factor,” Brian Stimpson, a graduate researcher from Texas A&M, wrote in paper SPE 181686. “The relationship between pore size and permeability can also be obtained through correlations to better predict reservoir properties.”
To simplify the problem, the model assumed all the pores were 15 nm. Stimpson is working to build a model with a more realistic range of pore sizes. Ultimately this line of work will raise another question: What is a reasonable representation of the pore sizes in an unconventional reservoir?
Those working to answer such questions do not have a lot of people to talk to.
“One of the reasons we showed our work to a bigger group is that we wanted a little bit of a peer review, to see if someone wants to beat us up,” MacDonald said after the presentation at URTEC, adding, “We didn’t get much of that.”
They see signs that others are -quietly working in this area. Geetan said that questions raised at SPE workshops as well as company-sponsored research at universities suggest that companies are thinking about similar things. Those working on these problems are drawing knowledge from such fields as material sciences, chemical engineering, and medical research.
“My petroleum engineering reading is down because it does not have much to do with what I am studying,” -Devegowda said.
This has not increased his popularity as a public speaker. “When I bring up this topic, there are only two reactions. Probably five persons in the room have read some papers related to chemical engineering and respond to what I am saying,” he said. As for the others in the audience, “I begin to see their eyes glaze over.”
For Further Reading
SPE 166306 Multiphase Compositional Modeling in Small-Scale Pores of Unconventional Shale Reservoirs by N. Alharthy, Colorado School of Mines; T. Nguyen, Computer Modeling Group; and T. Teklu, Colorado School of Mines et al.
SPE 172928 Analysis of Transient Linear Flow Associated with Hydraulically-Fractured Tight Oil Wells Exhibiting Multi-Phase Flow by H. Behmanesh, H. Hamdi, and C. Clarkson, University of Calgary.
SPE 181686 Effects of Confined Space on Production from Tight Reservoirs by B. Stimpson and M. Barrufet, Texas A&M University.
URTEC 2433692 A Systematic Investigation of Gas-Based Improved Oil Recovery Technologies for the Bakken Tight Oil Formation by L. Jin, S. Hawthorne, and J. Sorensen, University of North Dakota et al.
URTEC 2460396 Producing Gas-Oil Ratio Behavior of Tight Oil Reservoirs by R.S. Jones Jr., Newfield Exploration.
URTEC 2461115 Insights into Recovery Mechanisms in Shales through Digital Rock Technology by S. Geetan and R. MacDonald, EP Energy; and D. Klemin, Schlumberger Reservoir Laboratories.
Devegowda, D. Project to develop simulators for shale gas reservoirs. http://www.rpsea.org/projects/09122-11/
SPE 181585 Experimental and Theoretical Study of Water-Solute Transport in Organic-Rich Carbonate Mudrocks by A. Padin, Colorado School of Mines, and M. Torcuk, EOG Resources.
Clarkson, C. et al. 2016. Nanopores to Megafractures: Current Challenges and Methods for Shale Gas Reservoir and Hydraulic Fracture Characterization. Journal of Natural Gas Science and Engineering 31: 612–657.