Last year was a dynamic one for both oil producers and consumers. For much of 2017, oil prices headed north but consumption still outgrew daily production—even as those totals were rising too.
The net effect was seen as a positive for what has been a chaotic oil market in recent years. However, an annual report from BP's economic group that studies market forces for the company has raised questions about what could disrupt this tenuous balance going forward.
Driven by rising but still relatively low prices, 2017 saw world oil demand increase by an impressive 1.7 million B/D. This 1.8% increase stands above the 10-year average of 1.2% and marks the third year in a row that these figures have seen an uptick.
“But there were some signs in the product mix that the boost from low oil prices may be beginning to wane,” said Dale Spencer, the chief economist at BP, who noted one leading indicator has been the slowing usage of gasoline as prices trend up.
The report goes on to explain that other, and arguably bigger, factors that will influence the near-term outlook are how OPEC will correct its “overshoot of production cuts” and how the US shale sector deals with capital and logistical constraints.
The Big Unknowns
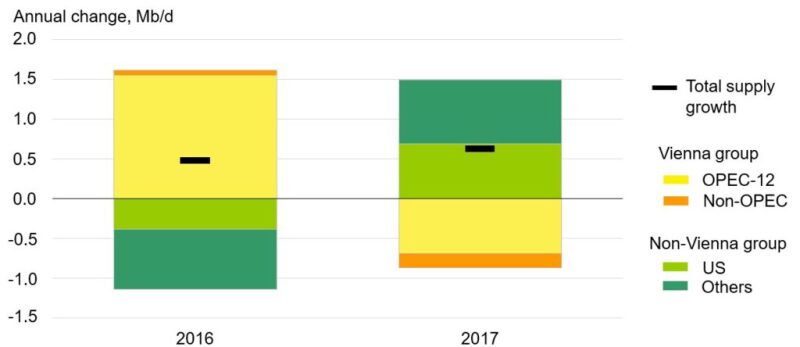
Rising crude demand, led by China and the US, continued even as the 12-nation members of OPEC and other 10 other leading exporters, known as the Vienna group, saw their coordinated reductions in output drop beyond the target level. This was largely due to the rapid demise of Venezuelan production that has been brought about by its political and economic crisis.
The goal set by the Vienna group, which includes Russia, was nearly 1.8 million B/D compared with the actual cut hitting about 2.5 million B/D. Despite how this played out, Spencer concludes that the OPEC cuts worked in alleviating a global glut and brought crude stocks down to “normal levels.”
“That said, the impact of the production cuts would have been even bigger had it not been for the response of US tight oil and [natural gas liquids], which have grown by almost 2 million B/D since October 2016,” he added.
This balancing of the global equation is what many in the industry will continue to focus on for the rest of 2018 and likely beyond. While OPEC was able to pull enough levers to stabilize and bring prices to a healthy level, the BP report concludes that the cartel and its allies have limited influence on prices these days.
“If OPEC tries to resist more permanent or structural changes in the market, there is an increasing risk that these actions will quickly be cancelled out by the responsiveness of US tight oil,” asserted Spencer in his comments shared during the report’s release this week.
But the US shale sector might be running into its own constraints as well, the boundaries of which are just starting to be tested.
From mid-2016 to mid-2017 shale producers saw their per-rig productivity drop before beginning a modest rebound. This drop in efficiency is largely attributed to the growing inventory of drilled-but-uncompleted wells. The BP report suggests that new logistics and supply chain bottlenecks that may intensify as they collide with wary investor sentiments and slow down overall production growth.
Read the full report here: BP’s Statistical Review of World Energy 2018