In less than 3 years after starting up, Reveal Energy Services’ first-to-market technique for interpreting offset-well pressure data has been used to monitor more than 5,000 fracturing stages.
Its chief deliverable is a pressure-based map of a well’s hydraulic fracture geometry—the length, height, asymmetry, and direction of the manmade hydrocarbon-conduits. These maps help producers understand how effective their completion designs are at stimulating tight-rock reservoirs, but the data used to make them has led Reveal to some deeper insights.
One of them may amount to an assessment of frac hit severity, which would give operators a clearer idea of whether new fractures directly impacted an offset well, or if the interference was due to more benign mechanisms such as a pressure front moving through the rocks.
Although this work is largely in the research and development stage, it is addressing the fact that many operators struggle to understand the full impact of well-interference until months after production begins.
The other new development has been commercialized, and is a data-driven process that shows operators which diversion schemes are likely to work best in their wells. This application not only improves cluster efficiency, but can potentially mitigate or control fracture interference too.
Diffusion or Direct Hits?
Sudhendu Kashikar, Reveal’s chief executive officer, spoke about a typical completion project where the monitoring system initially detected normal hydraulic fracturing behavior between two wells. But as the treatment moved from the toe-end stages of the child well towards stages in the middle, a “very different response” was seen in the fracture growth pattern.
Kashikar explained, “If you look at the fracture geometries, and the rate at which the fractures are growing, you can clearly see certain stages [in the child well] that were being impacted by the depleted zone, and conversely, that this frac was impacting the parent well.”
Detecting is one thing, but if this startup is able to grade such responses it would be a big development for the unconventional world because, “once you understand the cause, then you are in a much better position to say if it is going to be detrimental to production or not,” he added.
Used in multi-well fracturing operations, Reveal’s technology works by filling an offset well with water (or any incompressible fluid), plugging it at a certain fracture stage, and then using wellhead pressure sensors to monitor how that fluid column reacts as offset stages in the treatment well are fractured.
These pressure responses are then modeled to map out each stage’s fracture geometry. For each stage, this map is ready for operators within a couple of hours, or what the industry calls “near-real time."
Somewhere within this process, Reveal thinks it will find the clues needed to say whether the pressure increases seen during fracturing jobs are due to changes in rock stress or a diffused pressure front, both of which put the squeeze on a neighboring well’s fracture network (yet are not viewed as highly damaging). Or, the analysis could tell them that a full breakthrough of fluids and sand has happened (viewed as the most damaging outcome).
The Double Dose Test
In addition to using this pressure-monitoring technology to diagnose frac hits, the next thing operators want to know is what can be done about them? At Reveal, one answer is the better use of diverter technologies to reduce fracture asymmetry.
The shale sector has been testing and debating how diverters, made of glue-like polymers or solid materials called mechanical diverters, can help prevent a small number of perforations within a cluster of several from becoming dominate and taking in too much of the fracturing fluids, which will lead to overly-extensive fractures, and very possibly frac hits.
The other downside of these aggressive fractures is that they are known to leave half of the other perforation clusters in a well under-stimulated, which greatly reduces the highly sought after near-wellbore fracture complexity.
For several years, producers have faced great difficulty in mastering their usage of diverters, but Reveal appears to be making it easier. Kashikar said the company has found through field work that, “the material is important—but more important are simple things like the quantity and timing of the diversion drop.”
This conclusion is based on a project the company worked on with Houston-based shale producer Linn Energy to compare different diversion schemes in its Oklahoma development. Details were presented in a technical paper at the 2018 Unconventional Resources Technology Conference (URTeC 2902114), in Houston this past July.
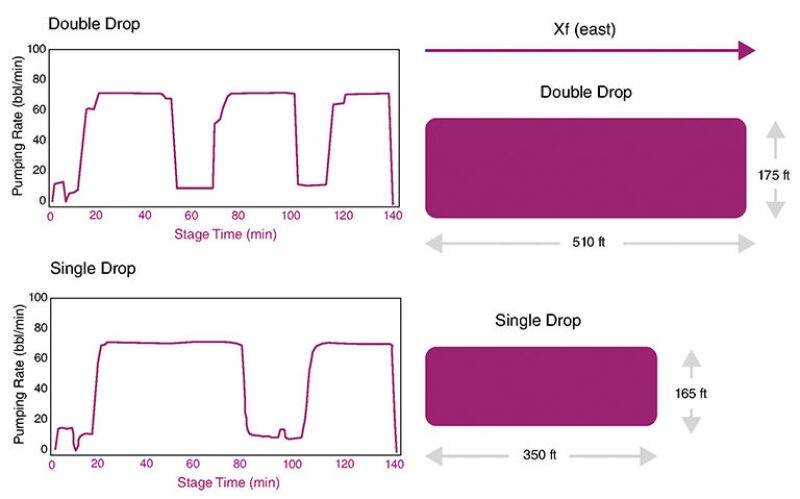
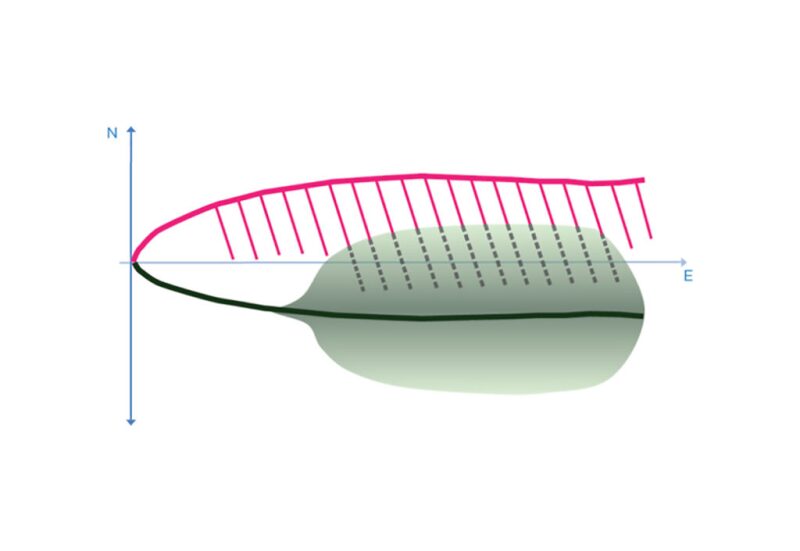
In one test, a single dose of diverter was sent downhole during the middle of a frac job. Pressure data reflected that this drop did not stop the longest fracture from continuing to grow, which also meant that fractures on the west side of the well (the side facing the reservoir’s depleted zone) were more than twice as long as the fractures on the east side.
In a second test, about a third of the prescribed treatment fluids were pumped before sending down one dose of diverters, another third of the fluid was pumped, and then a second dose was administered. The final volumes of fracturing fluid were then pumped to completion.
The result in this case was a much more symmetrical fracture geometry on both sides of the well, and the growth of the longest fracture was halted.
The bottom line is this: if operators can use this diversion data to establish more equally distributed fractures, they have the potential to control what might otherwise be damaging fracture inference.