Oil producers are a secretive lot, but satellite imaging is offering increasingly detailed reports on what is happening on the ground.
Satellite imaging used by the World Bank to estimate emissions from flares burning billions of cubic meters of natural gas every year offer an indirect look at oil output.
“Economics and changes in oil production result in changes in flaring,” said Martyn Howells, technical network coordinator in energy for the World Bank, adding, “The amount of gas you flare for a given volume of oil is pretty constant.”
A key part of his job is the Global Gas Flaring Reduction Partnership (GGFR), a public-private partnership formed by the bank. Flaring reduction is a priority because carbon dioxide emissions are thought to contribute to climate change, and wasted gas reveals missed development opportunities. For example, in Iraq, where power shortages have regularly led to mass public protests, 13 billion cubic meters of gas a year are flared.
Over the long term, flaring has been reduced. Flaring reduction partnership data going back to 1996 shows that the volume of gas burned globally is down 15% through 2017, while oil production grew during that time by 33%.
Space observation was used because companies and governments generally disclose little about flaring. Infrared radiation readings gathered and processed by the US National Oceanic and Atmospheric Administration, combined with information on flare locations and production estimates, produced a nation-by-nation annual report on flaring.
As satellites get smaller, cheaper, and far more numerous, oil traders and operators are using satellite imaging to gather intelligence, ranging from how much oil is loaded for export to what equipment competitors are installing on sites testing enhanced oil recovery methods.
The trick is finding observable data points that offer insights. While the oil industry treats flaring as a way to dispose of an unwanted byproduct, to an outsider it can reveal a lot.
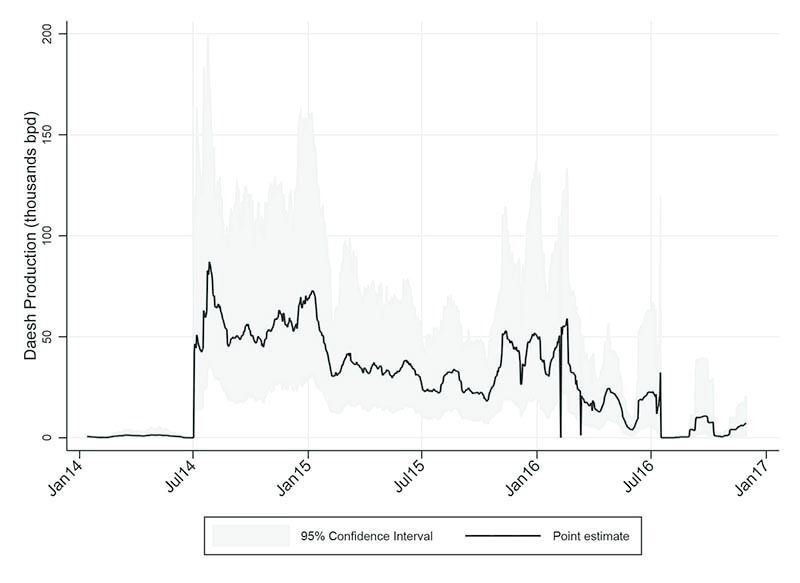
Satellite observations of infrared radiation and tank truck movements plus historical production records were used to estimate production by the Islamic state, known as ISIS, which depended on oil sales for cash, according to a World Bank report. Officials used “satellite multi-spectral imaging and ground-truth pre-war output data to effectively construct a real-time day-to-day census of oil production in areas controlled by the terrorist group,” the report said.
Over time, officials observed production falling from 42 sites under the group’s control. Its output peaked at 86,000 B/D in late July 2014 and fell to 16,000 B/D in 2016 as ISIS lost territory.
Those estimates were ultimately compared with ISIS records, which were seized in a raid by the US Army. The World Bank paper said the estimates were “well within the bounds of our 95% confidence intervals and actually very close to our point estimates.”
Infrared Insights
When the World Bank began gathering flaring data in the mid-1990s, it relied on a US weather satellites that took nighttime pictures of lights on the ground around the world.
Flares from major oil plays shine bright, but so do big cities. To distinguish between big cities such as Baghdad, and the oil fields in southern Iraq, World Bank staffers sorted the images using oilfield flare information from Cedigaz, an international natural gas association.
The method changed in 2012 when high-resolution, infrared data became available from a new NOAA satellite, the Virtual Infrared Radiometer Suite, known as VIIRS. It allowed direct identification of flares. Howells says they were surprised to see the new data from VIIRS closely followed the old trend line.
Infrared was a big step forward because flares, which are “the hottest things burning,” emit a lot of energy at the short wavelengths just beyond the red end of the visible light spectrum.
The science behind flare estimates goes back to the 19th century when the famous physicist Max Plank found that hot bodies emitted distinct short wavelengths based on temperature.
With infrared, there is no confusing street lights with flares burning at 1,000-1500o C, depending on the gas mix. While biomass, like wood, burns hot, the heat of a forest fire is not as great, and its wavelength is different.
The same data identifying the source of the energy also plot the intensity of each one observed. The peak of a small flare and a big one will be the same wavelength, but the big one will be taller.
Multiple equations are used to calculate the temperature, radiant heat per square meter, and surface area. Earth-based data is still required to correlate the data and delete extraneous sources, such as refinery flares, from a survey targeted at oilfields.
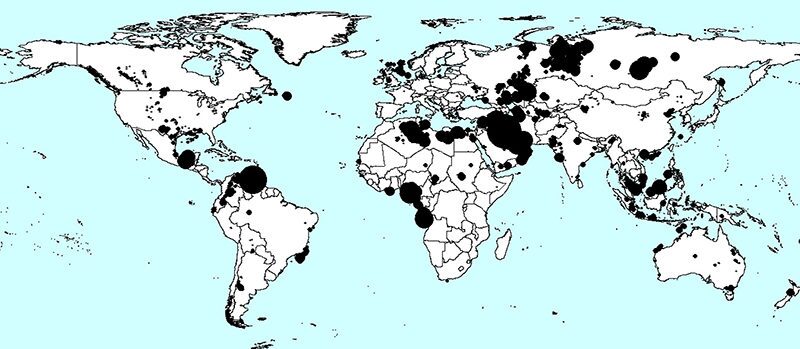
Some flares are so enormous they are easy to spot, even from space. Last year, 70 flares accounted for 20% of the flared gas on Earth, and 48 of those were in three countries: Iraq, 24; Iran, 17; and Venezuela, 7.
Flaring changes tell many stories. In Russia, the world’s leader in gas flared, flaring was down in 2017. Last year it limited production as part of a deal with OPEC to reduce oversupplies of oil, and gas demand was up as it increased exports to Europe by 8.1%, according to Gazprom.
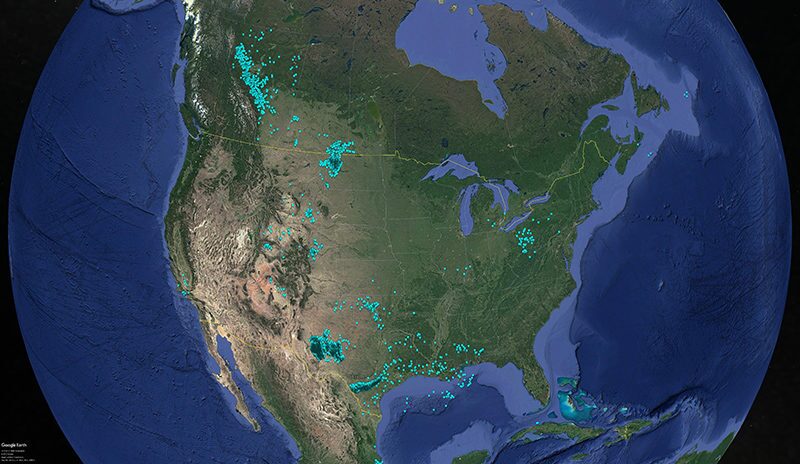
In the US, home to half of the world’s flares, flaring increased in 2017 but the percentage increase in production was much greater.
In countries where there has been conflict, such as Syria, Yemen, and Libya, flaring rose because oil money is urgently needed. Howells said that under those difficult circumstances, spending money on “maintaining gas gathering facilities is not a top priority.”