Yet another SPE paper has concluded that old wells outperform new ones, but this study offers a lot more detail about development in the Permian.
The paper, authored by Schlumberger (SPE 194310), offers comparisons of five major plays in the Midland and Delaware basins, including details down to the pounds of proppant pumped per foot, that show that completions are becoming increasingly similar.
“In general, normalized production from child wells is lower than parent wells,” said Wei Zheng, production stimulation engineer for Schlumberger. Older wells outperform newer ones even when adjusting for the fact that new horizontal wells extend further through the reservoir and more proppant is pumped.
“We are getting the same result as 5 years ago when we were spending less,” she said during a presentation at the recent SPE Hydraulic Fracturing Technology Conference.
First and Last
In the process of reaching that conclusion, the latest paper traveled through a forest of charts, offering an unusual level of detail showing that what you see in production numbers from the Permian’s Midland and Delaware basins can be deceiving.
Consider this chart showing that average daily production in the Midland Basin (black line) was better than ever in 2018.
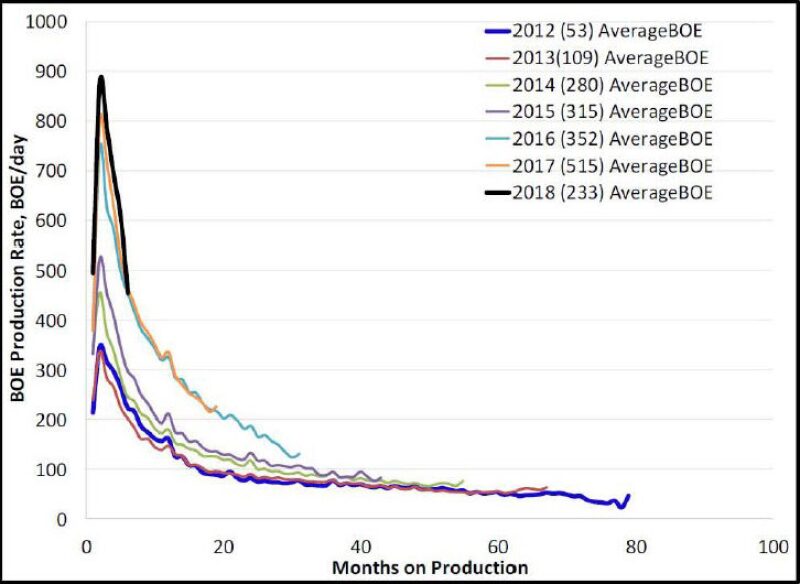
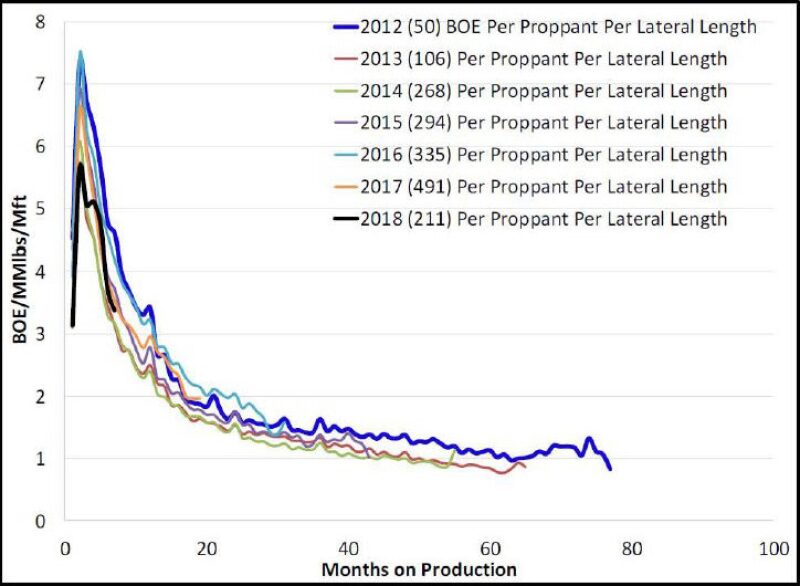
The message flips (Fig. 1) when the 2018 well results (black line) are normalized to reflect the added spending for longer horizontal laterals and added proppant to get more oil out of those reservoirs. Those added costs make last year’s wells look less attractive than wells from previous years that produced more for less.
Next Generation Rising
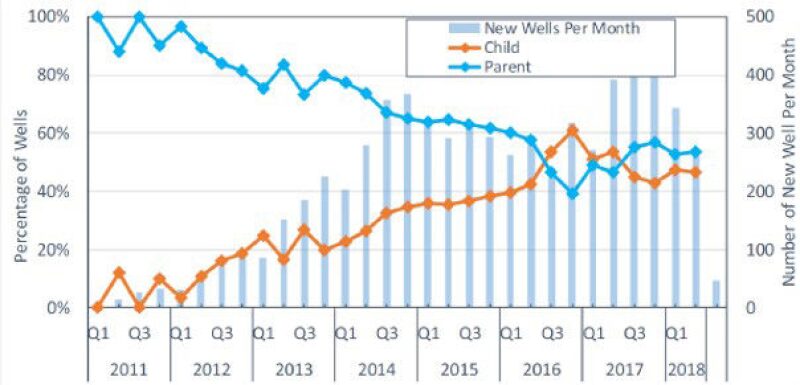
The parent-child relationship increasingly matters (Fig. 2) because the number of infill child wells drilled is nearly equal to the parent wells in the Permian, and rising. As the number of wells rises, it will become harder to find wide-open acreage where a well will not be competing with other wells nearby. The chart for the Delaware follows a similar trend.
Alike and Different
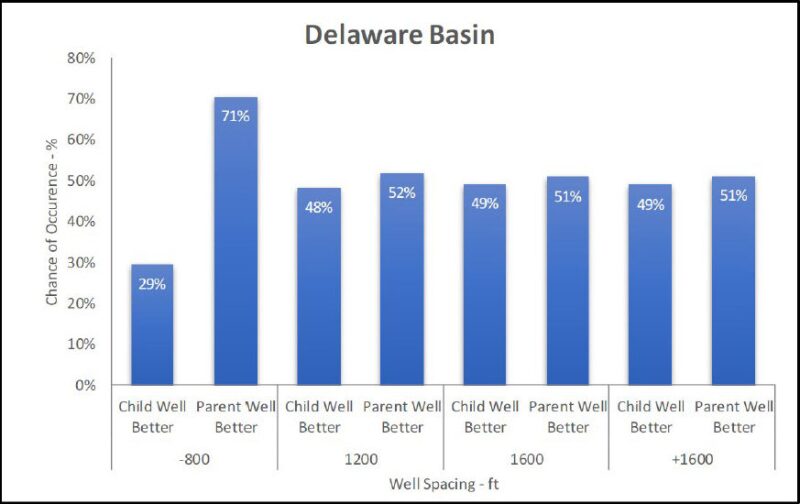
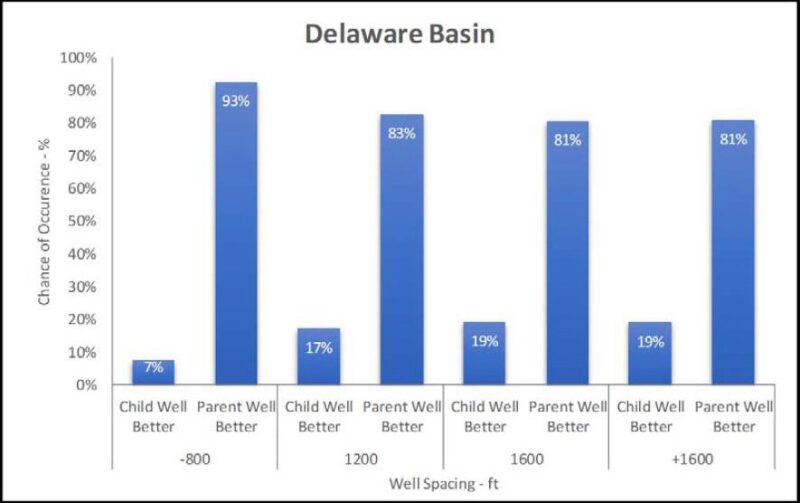
Based simply on production, parent and child wells (Fig. 3) produce about the same amount of oil if infill wells are spaced more than 800 ft apart. Wider spacing is critical. In both these basins, spacing from 800–1,200 ft apart is the transition zone in which child well performance exceeds parent wells based on the first 12 months of production.
When those comparisons are adjusted for differences in the wells and the completions (Fig. 4), it is not close. After adjustments, the original wells in the Delaware with cheaper completions win easily, and that holds true in the Midland.
Getting Less Different
Over time, performance differences due to variances in lateral lengths and proppant used are shrinking (Fig. 5) because new wells generally follow the trend toward more proppant and longer laterals.
Parent-child well comparisons examine wells completed at least one year apart, which is about half of those studied, according to Schlumberger. Year-to-year changes have slowed. Westwood Global Energy Group recently reported that the average amount of proppant used in the Permian was up 8% in 2018 from 2017, compared with a 26% change from the previous year. The average lateral length rose 5% in 2018, off from a 6% change in 2017.
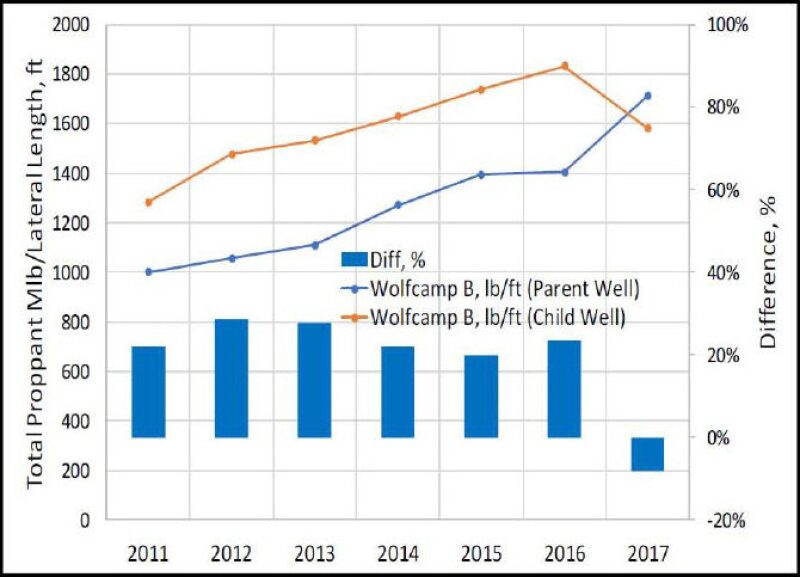
Charts of proppant use over time in the Delaware and Midland basins show that the differences in child and parent wells have narrowed. Parent wells are getting more proppant in the Wolfcamp B formation in the Midland basin (Fig. 6).
If this trend continues, ultimately there will no longer be big, predictable differences in the laterals and completions used for most new and old wells. There are plenty of other factors that can lead to performance differences in wells. But most of those are subsurface factors, from differences in the rock mechanics or the effectivness of a limited entry fracture design.
Abrupt Ups and Downs
After a year of production, the paper said the annual decline rate was 60–70% in both the Midland and the Delaware.
The work was based on data matched to specific plays. Schlumberger matched well data from IHS Markit with depth parmeters for major plays from the Bureau of Economic Geology at the University of Texas at Austin.
In the Midland Basin, it studied the Lower Sprayberry and the Wolfcamp A and B. In the Delaware it was the First, Second, and Third Bone Spring, the Avalon, and the Wolfcamp A and B. The paper included a table showing 5–7 years worth of data used to calculate decline curves for each play. That included the number of wells, total proppant per ft, the predicted estimated ultimate recovery, and two factors used to calculate the decline curve (b value and Di,A,e).