
Multistage horizontal well designs were first implemented in the Bakken in 2007. Since then, more than 12,000 wells have been completed in either the Middle Bakken or Three Forks zones. Early-time production rates, as measured by 180-day state-reported cumulative production, have increased fourfold during this period, during which industry has pursued a program of innovation and continuous improvement in completions technology, with production per well increasing in 10 of 12 years. Through a big data analytical study comparing geological data, completions parameters, and state-reported production results, the authors have evaluated the fundamental changes that have guided industry to these production rates during the period discussed.
Geology
The Bakken Formation is Mississippian and Devonian in age and consists of Upper, Middle, and Lower members. The focus of this paper is to review work in both the Middle Bakken member and the lower Three Forks intervals contained within the Bakken Petroleum System. The Upper and Lower Bakken shales are the prolific source rocks for the petroleum system. The Middle member consists of distinct lithofacies that range from silty sandstone on the east flank of the basin to silty dolomite on the west flank. Porosities in the Middle member range from 4–10% and permeabilities are generally less than 0.1 md.
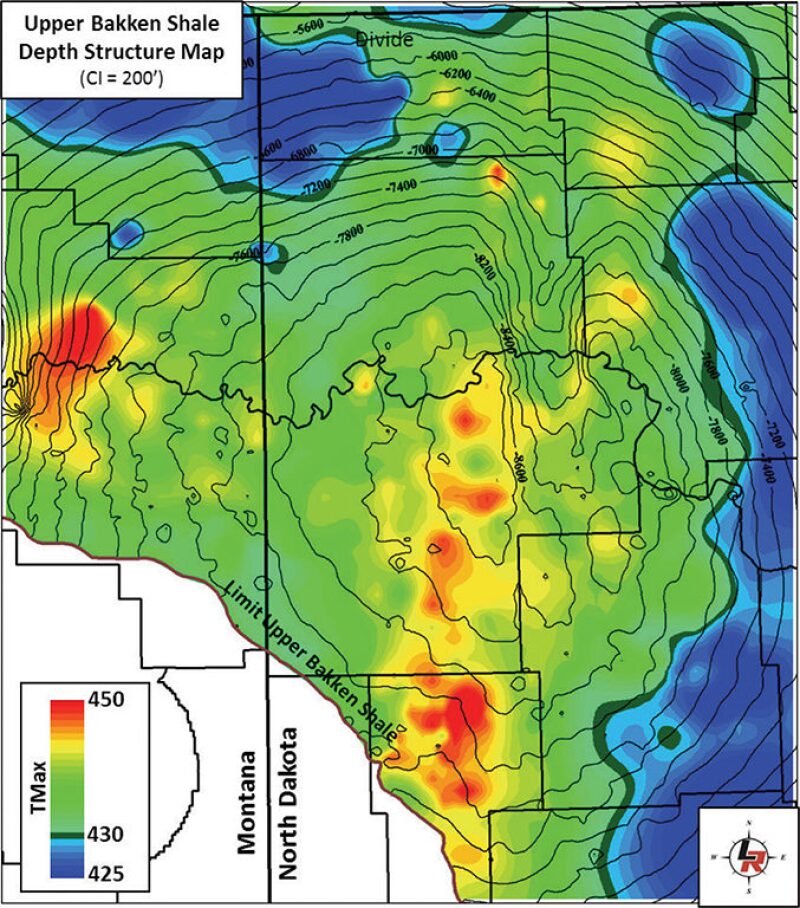
Fig. 1 shows the basin depth structure map with a color fill of the thermal maturity of the Upper Bakken shale. The onset of oil generation occurred at a pyrolysis temperature (Tmax) of greater than 430°F as indicated in the figure by shades of green and warmer colors. Oil generation in this thermally mature window created overpressure and resulted in oil mobilization into less-mature and immature regions toward the extremities of the basin. The Bakken is a basin-centered system and thus the increased pore pressure that occurred with the process of kerogen conversion and the generation of oil has resulted in pore pressure gradients as high as 0.9 psi/ft in the deepest part of the basin. Unsurprisingly, in the deepest part of the basin, water cut is the lowest, with increasing water cut with distance from the areas of greatest thermal maturity.
The complete paper provides a detailed description of the Bakken development history, which the authors divide into seven periods beginning with first production in 1953 to the present.
Production
Bakken production has grown historically, but as recently as early 2004 it yielded only approximately 25,000 BOPD. The increase in drilling activity then drove production growth, with an initial peak in December 2014 of 1.22 million BOPD. The rapid decline in industry activity then resulted in a significant production drop. However, the decline reversed, and new production records of 1.23 and 1.24 million BOPD were set in June and July of 2018. The return to peak production levels has been driven by companies using more-effective completions.
The nearly sixfold increase in early-time production over 12 years, and the fourfold increase since the advent of multistage completions in 2007, has been driven by a variety of drilling and completion factors. The most critical of these are the increased use of long lateral wells (10,000-ft laterals became standard), the increased use of mechanically isolated completion stages, and an increase in the amount of proppant pumped per well.
Interestingly, this increase in productivity exists across all areas of water cut within the basin. The wells can be broken into four equally sized quartiles on the basis of their producing water cut: 25% of the wells have 0–22% water cut, 25% of wells have 22–36% water cut, 25% of wells have 36–50% water cut, and 25% of wells have 50% or greater water cut. Industry expanded into higher water-cut fringes of the basin during 2012 to 2014. Despite this expansion into poorer-quality rock, however, productivity continued to increase and the contraction to the core of the basin since 2014, coupled with continued completion advances, has driven productivity even higher.
Several well factors have contributed to this increase in production. The industry has learned rapidly to improve completions technology, the result of a highly competitive and innovative environment championed by more than 50 mostly independent operators. Key among these variable changes are
- Increasing length of laterals, with a recent trend toward 15,000-ft laterals
- Rapid increase in the number of mechanically isolated stages per well completed, and a consequent decrease in stimulation stage length
- Shift from uncemented to cemented completions
- Almost 100-fold increase in the total amount of proppant pumped across the basin
- Order-of-magnitude increase in the amount of proppant pumped per lateral foot
- Twenty-fold increase in the total barrels of fracturing fluid pumped per well
- Fifteen-fold increase in the amount of fracturing fluid pumped per lateral foot
- Significant increase in the use of low-concentration stimulation designs
Multivariate Analysis
The typical work flow steps for using a multivariate analytical tool in determining parameters affecting well performance include
- Develop a list of potentially relevant geological, well, and completion attributes to be modeled. For statistical validity there should be a minimum of 10 well files per attribute.
- Select a performance metric to be analyzed; this is typically cumulative production over a period.
- Analyze the data using “outlier” analysis to discard spurious input data
- Analyze the data for collinearity
- Run the model to analyze sensitivities to input parameters
- Remove attributes with negative sensitivities one at a time to increase overall correlation coefficient
- Analyze each attribute’s transformation to ensure it is not statistical aberration
As analysis in the Bakken has become further refined, it has become typical to use a much larger parametric data set. The completions engineer can generate a series of individual transformation plots which then can be analyzed to evaluate the effect of varying the previously mentioned parameters. The result of such large data-set analyses has been a continuous improvement in well performance across the industry.
Ongoing Completions Optimization
The industry is continuing to increase the fracture intensity of its well completions, including increases in the following aspects of completion:
- Number of mechanically isolated stages per well
- Proppant loading
- Volume of fracturing fluid
- Slickwater fracturing designs
- Cemented laterals
Significant changes also have occurred in a number of completion design elements typically not recorded by reporting forms and state databases. Many operators use a combination of high-density perforating and extreme limited entry, which focuses on creating an increase in the number of effective fracture initiation points per stage and per well.
Other means of completions optimization include:
- Solid particulate diverter
- Geoengineered completions
- Radioactive tracer data for horizontal-completions diagnostics
- Post-fracture fiber-optic warmback and production logs
Economics
The robust well economics experienced during the development period during 2010 to 2014 that saw the completion of 9,521 wells was not to last. The collapse in oil prices in late 2014 and 2015 resulted in the rapid and sustained drop in activity in 2015 and 2016.
At the end of 2014, Liberty Resources’ Generation 1 completion design was no longer economical. With cost cutting and a variety of completion-design changes, the company moved to what it termed its Generation 4 design, which resulted in investment rates of return on drilling greater than 40%—higher in 2016 at $50/bbl than they had been in 2014 at $90/bbl. Three components drove this improved performance:
- A cost-effective completion using sand proppant, together with service-company price reductions, that dropped well costs to $6 million/well
- Overall higher-performing completion using 650 lb/ft of proppant
- Incorporation of a completion design that dropped stage count from a high of 50 stages per well to a typical stage count of 27
Since 2017, there has been an increase in both material and service costs of approximately 15%. However, 2018 investment returns were even higher, with an internal rate of return of greater than 50% because of a combination of improved commodity pricing and an approximately 25% improvement in the company’s well performance by moving to a newer completion design incorporating many of the elements discussed in the complete paper.
Conclusion
The value of developing completion databases and benchmarking well performance cannot be overstated. Determining and applying the best completion techniques to the right unconventional reservoir description is the driver of value creation and the primary driver for making an asset economical in a timely manner. Bakken production output from the Williston Basin is currently at record levels of over 1.2 million BOPD. Despite rig activity at only one-quarter of its peak, advances in drilling efficiency and completed well productivity will continue to drive output higher.
This article, written by JPT Technology Editor Chris Carpenter, contains highlights of paper SPE 191455-18IHFT-MS, “Twelve Years and 12,000 Multistage Horizontal Wells in the Bakken: How Is Industry Continuing To Increase the Cumulative Production per Well?” by C. Mark Pearson, SPE, Larry G. Griffin, SPE, Stacy L. Strickland, SPE, and Paul M. Weddle, SPE, Liberty Resources, prepared for the 2018 SPE International Hydraulic Fracturing Technology Conference and Exhibition, Muscat, Oman, 16–18 October. The paper has not been peer reviewed.