Summary: With the goal of maximizing profits, the performance of a hydraulic fracture treatment for reservoir stimulation can be quantified by evaluating the net present value (NPV). This article gives a bird’s eye view of the elements governing the NPV of a fracture treatment.
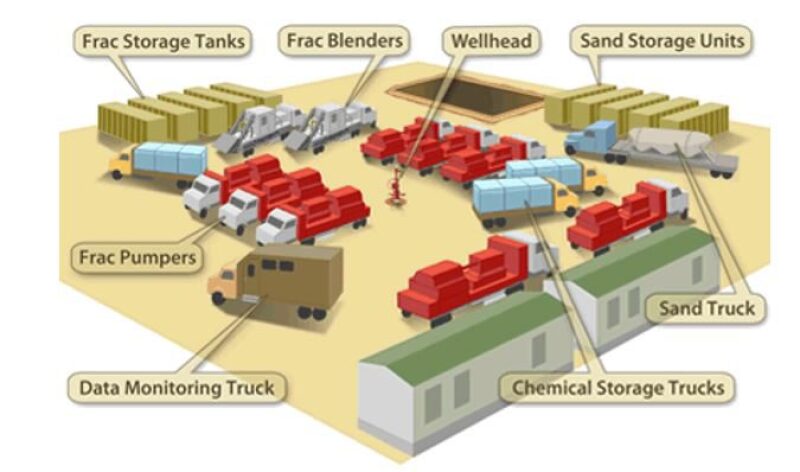
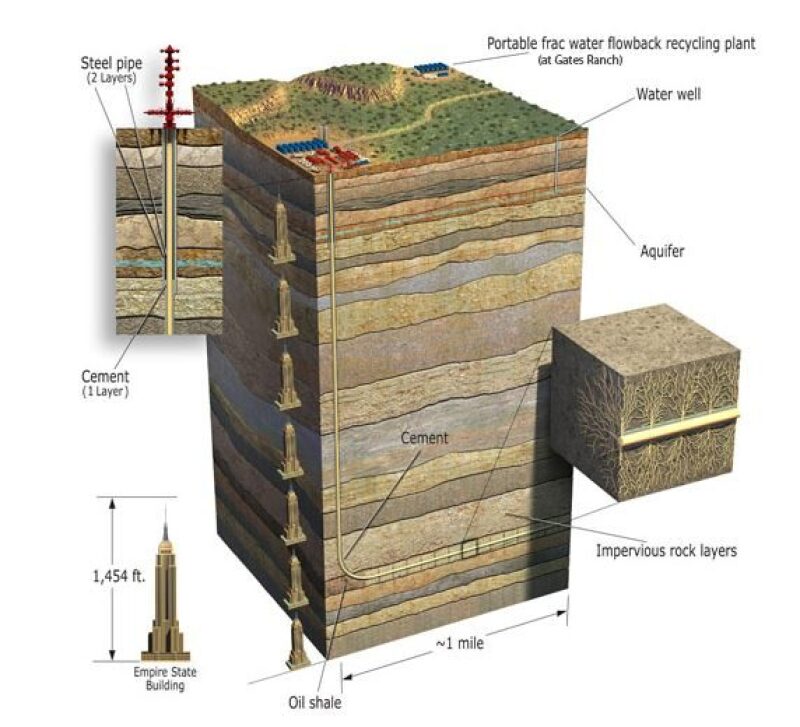
Hydraulic fracturing is a method that has been used in oil fields since the 1940s for reservoir stimulation (Fig. 1a). It increases permeability around the wellbore and improves the well’s connection with the surrounding reservoir (Fig. 1b). This is accomplished by pumping a high-pressure slurry comprising water, proppant, and chemicals creating cracks that propagate through the rock matrix, or by causing slippage along natural pre-existing fractures. At the end of pumping, these fractures are maintained by proppant that is placed in the fractures. Commonly, 20 to 60 fracture stages are placed in a horizontal well with four or more fractures pumped per stage simultaneously.
The industrial impact of this technology has been massive and is responsible for the advances in the development of tight unconventional resources such as shale gas, which would otherwise be non-producible.
Economic Performance Overview
The incremental performance of hydraulically fractured well is realized over a long-term period, thus those incremental revenues need to be discounted to time zero in order to properly value them. On the contrary, the costs of performing the stimulation job are short-term. Thus, according to Balen et al. (1988) the NPV can be calculated using:

where, ΔTRt is the total incremental revenue, above what the unstimulated version of the same well would produce for the tth year, with N being the total number of years for the period over which NPV is calculated, and ir is the discount rate, commonly known as the “time value of money,” which is at least equal to the rate of inflation.
Factors Controlling the Treatment’s NPV
The ideal hydraulic fracture treatment maximizes reservoir deliverability, proppant coverage, optimizes pump output with the fracturing fluid, and at the same time minimizes the total treatment costs, maximizing its economic returns (Balen et al., 1988).
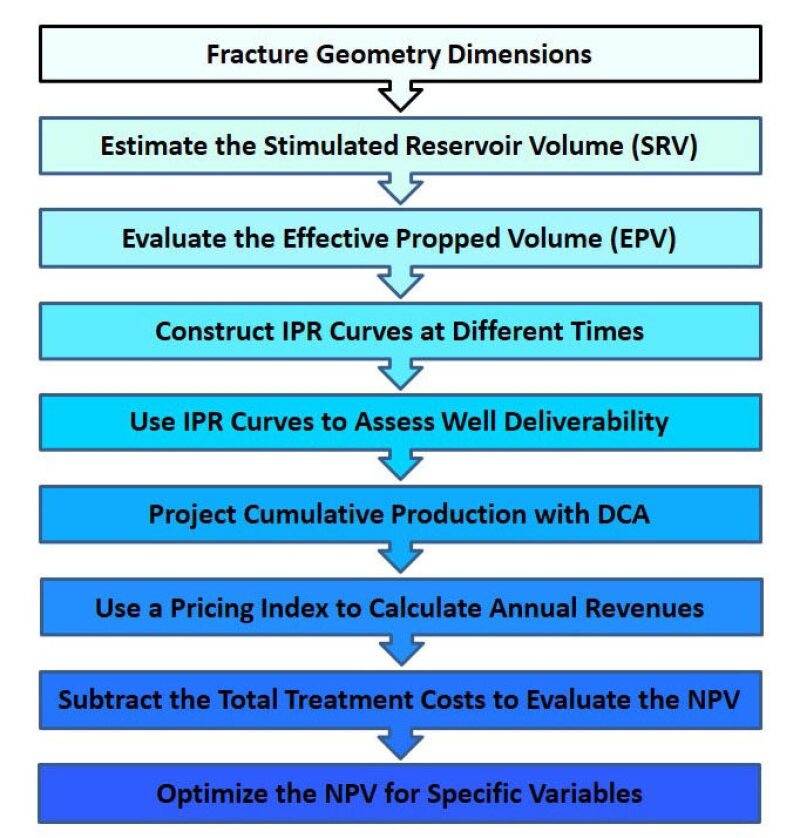
Fig. 2 summarizes the workflow for calculating the NPV of a fracture treatment starting from the fracture geometry dimensions. The factors governing the NPV can be placed into four groups as described below:
Fracture geometry and stimulated reservoir volume. An appropriate model for the geometry dimensions of the generated fractures is chosen. Most fracture geometry models are pseudo-3D such as the “PKN” (Nordgren, 1972) and the “KGD” model (Geerstma and de Klerk, 1969) implying that one of the dimensions (generally the fracture length) should be estimated. This estimation is usually made using results from microseismic studies (Fisher et al., 2004; Warpinski, 2009), scaled-laboratory testing (Michael, 2016) and complex numerical simulators (Wu, 2018). From there, the total stimulated reservoir volume (SRV) can be computed.
Propped volume and well deliverability. After the fractures are generated, proppant is pumped to keep them open and provide a pathway of high permeability to the wellbore for the hydrocarbon fluids. Effective propped volume (EPV) refers to the fraction of SRV, which has been effectively propped open and is capable of flowing (Maxwell, 2013). Transient inflow performance relationship (IPR) curves can be constructed as a function of time and coupled with tubing performance test to determine well deliverability (Balen et al., 1988).
Decline curve analysis and cumulative recovery. Once well deliverability is modeled, the recovery from the stimulated well can be predicted. Projections of the hydrocarbon recovery for the time period, over which the NPV is calculated, can be made using traditional decline curve analysis (DCA). This task becomes more challenging for unconventional reservoirs, which exhibit rapid production not predicted by conventional decline models.
Treatment optimization and total costs. The proppant volume, propped fracture geometry, hydraulic horsepower, and other miscellaneous can be optimized using procedures involving among others the pump's pressure/flowrate constraints, maximizing fluid efficiency, and proppant penetration. The NPV of fracture treatment can be optimized for independent variables such as the assumed fracture length, or the closure stress (Balen et al., 1988). Additional optimizations could be made for multiple fracture growth homogeneity (Michael, 2016) considering stress-shadowing in horizontal wells (Fisher et al., 2004).
Fig. 3 shows schematics of the NPV curves as a function of time for various scenarios compared to a base case in regards to the fracture treatment’s success and total cost. The total costs of the treatment affect “Region 1” of the plot, while the degree of the treatment’s success affects “Region 2” of the plot.
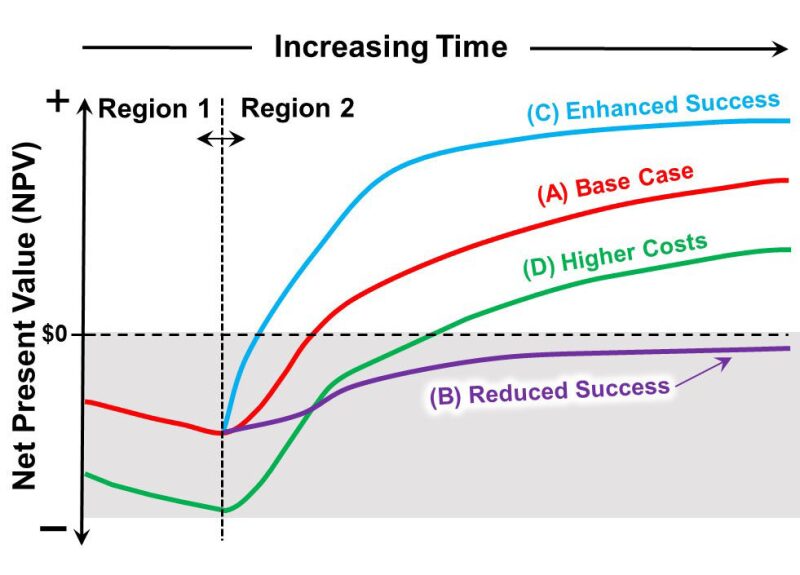
As shown for Case B in Fig. 3, as the costs increase, the Region 1 portion of the curve shifts down compared to Base Case A. This “drags” the remainder of the curve in “Region 2” down by the same amount, increasing the project’s payout time and ultimate NPV. Enhanced or reduced success of the treatment is indicated by the curves for Cases C and D, respectively, and affects only the “Region 2” portions of the curves. Enhanced treatment success shifts this portion of the curve up leading to shorter payout time and higher ultimate NPV.
Final Thoughts
A workflow for calculation of the NPV of a hydraulic fracture treatment can be the base for design optimization coupling the treatment’s technological and economic performance. This workflow can easily be coded and utilized for parametric studies.
Detailed knowledge of all factors contributing to NPV’s calculation allows operators to evaluate reliably and accurately the potential profitability of a fracture stimulation treatment. This value can be used to assess the contribution of the treatment on the well’s performance.
NPV can be optimized considering the dynamics of fracture parameters (e.g. geometry), well production (e.g. tubing size), and treatment total costs.
NPV calculations from each well can be combined for the total NPV for a fieldwide development.
References
Balen, R. M., Mens, H.-Z., & Economides, M. J. 1988. Applications of the Net Present Value (NPV) in the Optimization of Hydraulic Fractures. Society of Petroleum Engineers. doi:10.2118/18541-MS
Fisher, M. K., Heinze, J. R., Harris, C. D., Davidson, B. M., Wright, C. A., & Dunn, K. P. 2004. Optimizing Horizontal Completion Techniques in the Barnett Shale Using Microseismic Fracture Mapping. Society of Petroleum Engineers. doi:10.2118/90051-MS
Geertsma, J., & De Klerk, F. 1969. A Rapid Method of Predicting Width and Extent of Hydraulically Induced Fractures. Society of Petroleum Engineers. doi:10.2118/2458-PA
Maxwell, S. 2013. “Beyond the SRV.” Exploration & Production, Hart Energy, www.hartenergy.com/exclusives/beyond-srv-19778.
Michael, A., 2016. Hydraulic Fracturing Optimization: Experimental Investigation of Multiple Fracture Growth Homogeneity via Perforation Cluster Distribution, Master’s Report at the University of Texas at Austin.
Nordgren, R. P. 1972. Propagation of a Vertical Hydraulic Fracture. Society of Petroleum Engineers. doi:10.2118/3009-PA
Warpinski, N. 2009. Microseismic Monitoring: Inside and Out. Society of Petroleum Engineers. doi:10.2118/118537-JPT
Wu, Yu-Shu. 2018. Hydraulic Fracture Modeling. Gulf Professional Publishing.

The author would like to acknowledge TWA editors James Blaney and Michael Cronin for their review and inputs.

