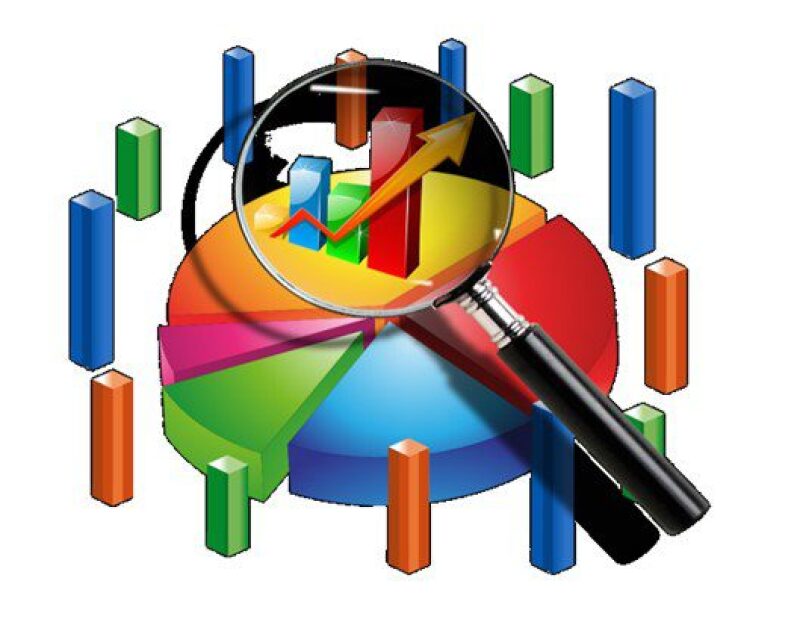
Data visualization is one of the more important tools in the arsenal of any data analyst. It helps provide stakeholders and other team members with quality information by transforming massive amounts of intangible data into easily understandable pictures and graphics. Visually displaying data makes it much more accessible, and this is critical for promptly identifying the weaknesses of an organization, accurately forecasting trading volumes and sale prices, and making the right business choices.
Why Humans Need Data Visualization To Understand Things?
The human brain is not able to understand or even just imagine large amounts of numbers or text at once. It needs a visual representation to make sense of them and consequently translate raw data into tangible concepts. Our brain is not wired to translate binary code; up to 50% of its activity focuses on visual processing only. Visuals are processed 60,000 times faster than simple text or numbers; an image requires just 13 milliseconds to be elaborated.
For example, try to imagine adding together 5 gallons plus another 15 gallons of a liquid. It is a very abstract idea that is hard to realize. Now, try to imagine adding a 5 gallons water bucket with a larger 15 gallons one together. That’s much simpler. That’s what data visualization is in a nutshell—a terrifically effective way to give a much more tangible shape to otherwise abstract data sets through colorful pictures, vectors, charts, dashboards, and graphics.
Why is Data Visualization a Critical Skill in 2019?
We live in the age of digital transformation. Big Data is, hands down, one of the protagonists of this technological revolution. With more than 2.5 quintillion bytes of data produced each day, unstructured data represents an untapped goldmine of information that can be used for a variety of purposes. Thanks to the enormous computing power of modern machines and the immense potential of artificial intelligence, we can finally make sense of it. As trend researcher and futurologist John Naisbitt clearly explained when talking about the importance of digital data: “We are drowning in information, but starving for knowledge.”
Data analysts are in high demand today, and they have been defined as the most sought-after career option in 2019. Data science jobs are predicted to grow to 2.7 million by 2020 with an average salary of nearly $60,000 per year, so the need for this type of professional is quite obvious. But knowing all about data mining is useless if one cannot present the information extracted in a clear and understandable way. Not every person in an organization is able to process data unless the information is digested and graphically displayed as a dashboard, graph, or map. Data visualization is a necessary skill used for converting data into actionable visual representations.
Historical Uses of Data Visualization
Humans learned how to present data in a clearer way with the use of graphs and images a lot of time ago—way before the computer revolution could be even imagined. The most ancient maps and navigation charts are the first example of data visualization and can be traced back to the beginning of human history. However, the Flemish astronomer Michael Florent Van Langren is credited with being the first to provide a visual representation of statistical data in 1644. He used a graph to represent the various estimates of the difference in longitude between Rome and Toledo available during his time. Other pioneers of this science include Charles Joseph Minard, who used several graphs to map critical information about Napoleon Bonaparte’s army during the Russian campaign in 1812, and William Playfair, who invented the bar, line, circle, and pie charts in 1821.