
Newly developed ambient seismic imaging methods provide valuable information throughout the life cycle of an unconventional field. Methods developed by Global Geophysical Services enable new insights for exploration, development planning, fracture and refracture design, reservoir management, production forecasting, and reserves estimation.
Ambient seismic imaging has also been used to monitor conventional reservoirs, waterfloods, CO2 sequestration, mine stability, and water influx into mines. Additional applications include geothermal systems and induced seismicity monitoring.
Many assume that the term “ambient seismic” (imaging artificial or natural seismic emissions) is synonymous with “microseismic” (imaging earthquakes with a magnitude ≤0, i.e., microearthquakes or MEQs). However, advances in the understanding of natural and induced seismic emissions and new imaging and analytical methods have differentiated these terms.
Microseismic methods typically locate MEQs by use of classical seismological methods: polarization angles and arrival times of P and S waves. Thus, the term “microseismic” implies methods relying only on MEQs, the “dots-in-a-box” long familiar to fracturing engineers and development geologists.
In recent years, research has shown that the majority of the seismic energy radiated during a fracture treatment is in seismic phenomena other than MEQs. Other emission sources include long-period, long-duration (LPLD) activity (Das and Zoback 2013a and 2013b), long-duration signals (LDS) (Sicking et al. 2014), and fluid resonance in the fracture system (Tary and van der Baan 2012).
These types of emissions cannot be analyzed with classical methods because they do not have distinct, noticeable first arrivals or recognizable P/S wave separation. Such emissions can persist or fade in and out for minutes to hours, rather than milliseconds, and therefore cannot be classified as distinct events such as MEQs. Furthermore, there may be other seismic phenomena that have yet to be identified and categorized.
Seismic emission tomography (SET) is an alternative to locating earthquakes with P and S wave arrivals and polarization angles. It is in wide use for surface monitoring and most recently for downhole monitoring. SET focuses total trace energy by means of ray tracing through the velocity model in short time steps (on the order of 100 ms), thus imaging energy from many types of seismic emissions, including MEQs, LPLD, LDS, fluid resonance, and possibly unknown phenomena.
Each computed SET time step produces a voxel-by-voxel depth image of seismic emissions in the same way that a 3D surface reflection seismic survey produces a 3D time image. MEQs located in individual time steps are termed “proxy hypocenters” because they represent brief, high-energy events. However, they are not identified uniquely as MEQs by classical methods.
The summing of SET time steps over extended time periods, from minutes to hours to days, results in 3D images of cumulative seismic activity with a high signal-to-noise (S/N) ratio. The S/N uplift results from two factors: that spatially stable signal stacks and random noise largely cancels in the stacking step. (Coherent noise must be removed at the trace processing stage before the focusing step.)
Images of natural and artificial fracture surfaces extracted from these volumes are termed Tomographic Fracture Images (TFIs) (Geiser et al. 2012; Copeland and Lacazette 2015). Extended summation periods are required for imaging fractures because seismic activity is episodic along a fracture surface.
SET-based summation results and data sets that are generated before drilling, and during and after hydraulic fracturing
- Identify acoustically active fracture zones, which may be sweet spots in an unconventional reservoir, before drilling.
- Directly image the stimulated reservoir volume (SRV), hydraulic fractures, and natural fractures stimulated by fracturing.
- Image active production volumes (APVs) (Sicking et al. 2015) after fracturing.
Fracture images can be imported into discrete fracture network (DFN) simulations (Lacazette et al. 2014) and inverted to determine the reservoir stress state (Lacazette and Morris 2015).
Predrill Imaging
Ambient seismic imaging provides valuable predrill information for exploration and development planning. Ambient seismicity during this period is the Earth’s natural, continuous background seismicity.
Seismic activity summation based on SET has been applied to imaging ambient seismicity before fracture monitoring with surface arrays and to quiet-time monitoring during 3D reflection surveys (Lacazette et al. 2013). Ambient images reveal fracture zones and volumes of rock that are likely to have high hydraulic conductivity/fracture permeability.
The method works because of the overall positive correlations between shear stress on a natural fracture and both hydraulic conductivity and seismicity. Features with higher levels of ambient seismicity are therefore likely to have higher fracture-mediated permeability.
In projects to date, high-activity fracture zones and rock volumes seen in predrill ambient images are correlated with areas of increased production in conventional fractured reservoir plays, zones of fluid loss during drilling, low fracture treating pressures, and the potential for fracture hits on adjacent wells.
Stimulation Monitoring
Signals recorded during fracturing directly image the fracture networks activated by pressure changes. Imaging during fracturing provides direct images of the SRV, the main induced fracture surfaces, and the natural fracture network stimulated by fracturing (Fig. 1-above), in addition to other results and data sets.
In this method, SRV is defined as the volume of high seismic activity connected to the wellbore during fracturing, based on a statistically determined cutoff value that isolates the stimulated volume.
The semitransparent rainbow-scale cloud in Fig. 1 shows the SRV volume. The fracture surfaces are the surfaces of high cumulative seismic activity extracted from the SRV cloud and are shown in gray scale, within the cloud (Copeland and Lacazette 2015). The figure also shows a horizontal slice of a TFI that reveals the seismically active natural fracture network over a much larger area. These large-area images use all voxels in each time step and do not have connectivity criteria. The TFI shown is a raster TFI, which represents the TFI as a one-voxel-thick surface.
Production Monitoring
Although it is similar to an SRV, an APV is an image of the reservoir volume that is seismically active during production. The same imaging methods are applied in the weeks, months, or years after stimulation to the fracture networks and the APVs.
Fig. 2 compares the same well during fracturing, during production, and after the fracture treatment of the adjacent well. As expected, the APV is substantially smaller than the SRV. What was unexpected was that the fracture treatment of the adjacent well would produce a substantial decrease in the well’s APV and a concomitant production decline approximately proportional to the decrease in volume.
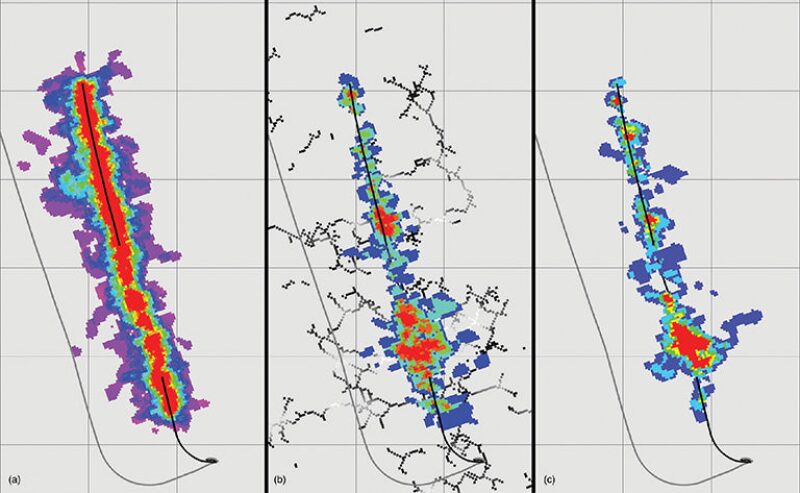
Although individual APV images can be acquired with surface arrays, repeat production monitoring of the type shown in Fig. 2 is more economical with permanent shallow buried arrays (typically 75 ft to 300 ft deep). Also, the array geometry must be the same for comparing volumes over time.
Applications
The volumes of cumulative activity, SRVs, APVs, and TFIs have direct applications for well development, completions, and production. They are as follows:
- Identifying heavily fractured areas before drilling so that they can be intersected or avoided, as appropriate
- Adjusting stimulation programs for fractured areas
- Determining optimum well spacing based on fracture length, SRV, and APV
- Obtaining an understanding of the interactions between wells and fracture hits
- Mapping reservoir-scale fracture flow networks for development planning
More advanced applications use the images for fracture simulation, reservoir simulation, and stress inversion. These applications rely on the cumulative activity volumes and TFIs. TFIs extracted directly from the stacked activity volumes are generated as tessellated surfaces, which are continuous surfaces composed of flat triangles with shared edges. The fracture surface shown inside the SRV in Fig. 1 is an example of a tessellated TFI.
The areas, orientations, cumulative activities, and time of activation are stored with each triangular facet. These surfaces can be exported in the TSurf file format, which is nonproprietary and widely supported. The surfaces can then be imported into orientation statistics, DFN simulation, geomechanical, and 3D visualization software.
DFN fracture and DFN reservoir simulations are conditioned using both cumulative activity volumes and tessellated TFIs. Orientation and density statistics of the TFI facets are used to calibrate fracture populations for stochastic DFN simulations (Lacazette et al. 2014). The areal density of fractures in simulations is conditioned with TFIs and/or the cumulative activity volume. Also, the tessellated surfaces can be imported directly into the DFN simulators and used as discrete features.
More accurate full-field reservoir simulations enable more accurate reserves estimates, production forecasts, and better stimulation programs and development plans.
A newly developed application inverts TFIs for reservoir stress by use of the established technology of slip-tendency analysis (Lacazette and Morris 2015). The cumulative activity on each triangular facet is taken as a measure of the slip-tendency. A computer algorithm searches for the principal stress orientations and relative magnitudes that best reproduce the observed population of slip-tendencies. If the stress magnitude in one orientation is known, then the relative stress magnitudes can be converted to absolute magnitudes (Lacazette and Morris 2015). The vertical stress is easily computed if a density log is run to the surface.
In summary, imaging cumulative ambient seismic activity over time, instead of only imaging MEQs, is the basis for a variety of reservoir characterization technologies that are valuable throughout the reservoir’s life cycle.
References
Copeland, D. and Lacazette, A. 2015. Fracture Surface Extraction and Stress Field Estimation From Three-Dimensional Microseismic Data. Presented at the Unconventional Resources Technology Conference, San Antonio, Texas, USA, 20–22 July. URTeC 2155064.
Das, I. and Zoback, M.D. 2013a. Long-period, long-duration seismic events during hydraulic stimulation of shale and tight-gas reservoirs—Part 1: Waveform characteristics, Geophysics 78 (6): KS97–KS108.
Das, I. and Zoback, M.D. 2013b. Long-period, long-duration seismic events during hydraulic stimulation of shale and tight-gas reservoirs—Part 2: Location and mechanisms, Geophysics 78 (6): KS109–KS117.
Geiser P., Lacazette, A., and Vermilye, J. 2012. Beyond ‘Dots in a Box’: An Empirical View of Reservoir Permeability With Tomographic Fracture Imaging.First Break 30 (7): 63–69.
Lacazette, A., Vermilye, J., Fereja, S. et al. 2013. Ambient Fracture Imaging: A New Passive Seismic Method. Presented at the Unconventional Resources Technology Conference, Denver, Colorado, USA 12–14 August. SPE 168849.
Lacazette, A., Dershowitz, W., and Vermilye, J. 2014. Geomechanical and Flow Simulation of Hydraulic Fractures Using High-Resolution Passive Seismic Images. Presented at the Unconventional Resources Technology Conference, Denver, Colorado, USA, 25–27 August. SPE 1935092.
Lacazette, A. and Morris, A. 2015. A New Method of Neostress Determination From Passive Seismic Data. Presented at the Unconventional Resources Technology Conference, San Antonio, Texas, USA, 20–22 July. URTeC 2174187.
Sicking, C., Vermilye, J., Lacazette, A. et al. 2014. Case Study Comparing Micro-Earthquakes, Fracture Volumes, and Seismic Attributes. Presented at the Unconventional Resources Technology Conference, Denver, Colorado, USA, 25–27 August. SPE 1934623.
Sicking, S., Vermilye, J., and Lacazette, A. 2015. Predicting Frac Performance and Active Producing Volumes Using Microseismic Data. Presented at the Unconventional Resources Technology Conference, San Antonio, Texas, USA, 20–22 July. URTeC 2154977.
Tary, J.B. and van der Baan, M. 2012. Potential Use of Resonance Frequencies in Microseismic Interpretation. The Leading Edge 31 (11): 1338–1346.