
Integrated asset modeling (IAM) properly models the interaction of fields producing through common production facilities and yields reliable production forecasts, compared with the use of independent models. Using integrated asset models helps validate independent models, honor facilities constraints, and, in general, support the decision-making process in reservoir management. This paper describes a case study in which four reservoir models were coupled with a production-network model, with the objectives of maximizing recovery factors, identifying operational problems, and evaluating water-production effects.
Introduction
Among the recent discoveries made by Pemex Veracruz Asset are four dry-gas fields with different geological and dynamic properties that must be produced through shared production facilities to be economic. This poses a complex operational scenario involving several questions that need to be answered: What is the optimum exploitation rhythm for each reservoir and its interaction on the surface? On the basis of the fact that one reservoir has an aquifer, what will be the effect on the recovery factor, and what are the challenges at the surface level? Regarding the differences in pressures and volumes, the selection of the compression stages will be difficult because each reservoir will require different capacity and startup dates. What, then, is the optimum compression scheme that generates the maximum value from an economic perspective?
As part of the field-development plan, the incorporation of new wells or a new field will be evaluated. What will be the effect of these new elements on the system?
To face all these challenges, a multidisciplinary team was appointed to analyze the system from different perspectives and design several exploitation strategies and evaluate them both technically and economically to select the optimum one to produce the fields.
The strategies should
- Manage reservoir pressures to reduce backpressure effects.
- Minimize the risk to produce water and support the design of water-handling facilities.
- Identify the wells with liquid-loading problems and low potential.
- Define the startup date of each compression stage so that all reservoirs benefit at the same time.
- Evaluate the scenarios economically, considering two schemes—buying and renting compression facilities.
- Evaluate the effect of future developments, such as workover, infill drilling, and the incorporation of a new field.
Field Description
The four fields are dry-gas reservoirs just inland from the Gulf of Mexico, approximately 110 km southeast of Veracruz City, Mexico. They consist of fine-grain-sandstone reservoirs of different formations (A is medium Miocene, B is superior Miocene, and C and D are inferior Pliocene) (Fig. 1 above). Hence, their geological and dynamic properties differ.
Internal faults were observed only in Field A; nevertheless, no difference in pressure behavior among their wells was observed to justify the subdivision of the field into blocks.
The drive mechanisms were mainly gas expansion, except in Reservoir B, where a gas/water contact was detected in three of the wells that contacted that formation and the influence of a lateral aquifer was clearly observed. The high risk of producing water from Reservoir B was a strong constraint in the aim of finding optimum production plateaus from all the reservoirs given that, at the time, there was not enough capacity to handle that water.
There was an uncertainty of 70 m in the position of the gas/water contact in Field A because one well in the field yielded water invasion when drilled; however, the contact was not observed in the next shallower well.
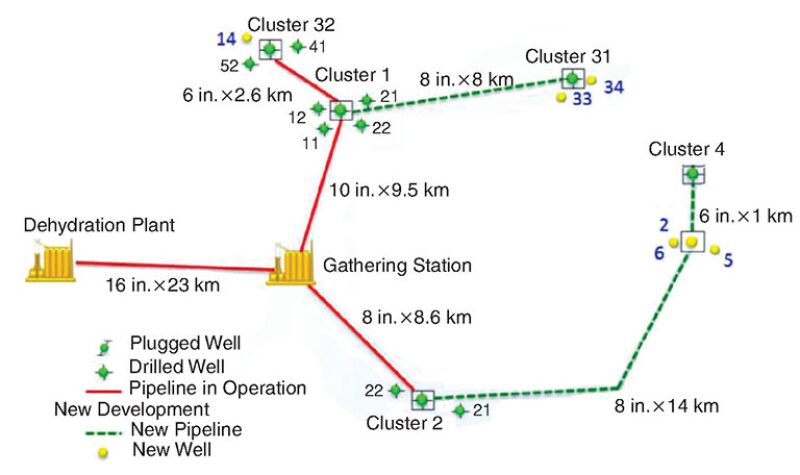
The surface facility consists of four clusters, named 1, 2, 31, and 32. Clusters 1 and 32 have producing wells from Reservoirs A and B. Cluster 31 has producing wells from Reservoir D, and Cluster 2 has producing wells from Reservoir C. Three main pipelines flow to the gathering station, and all the production is transported through 26-km-long, 16-in. pipe. The delivery pressure necessary to reach the dehydration plant is 960 psi (Fig. 2).
IAM
IAM is based on the simultaneous solution of reservoir-, wells- and network-simulation models at every timestep, considering the boundary conditions downstream and upstream through the whole simulation time.
The following steps are needed to create an integrated asset model:
- Data acquisition
- Built models
- Reservoir
- Well and network
- Economic
- Integration
- Reservoir/network balancing
- Coupling location
- Pressure/volume/temperature management
- Asset-management strategies
- Evaluation
Reservoir Modeling
All the reservoir models were built in a black-oil simulator because two-phase gas/water systems were modeled. The grids used were the same as those used for the static models because the number of active gridblocks in each model was relatively small (A had 42,331, B had 17,613, C had 29,365, and D had 5,445). Not upscaling either the grid or the properties distribution allowed the detailed description made by geoscientists to be honored.
Because most of the fields were relatively homogeneous, the initial water saturation was modeled easily with single capillary pressure curves, except for Reservoir B, for whose model the distribution was made with the Leverett-J function to mimic the water-saturation logs in each well and reproduce the early water breakthrough seen in Well B-41. This allowed a reliable model to be built to predict water breakthrough in the other three wells of the reservoir.
Three models were history matched from their initial production until October 2011, by use of uncertainty-analysis methodology.
The main uncertainty parameters were gas/water contact in Field A, aquifer properties in Field B, and permeability distribution in Field C. The response parameters against which the three models were matched were gas production rate per well and sporadic flowing and static bottomhole pressures in most of the wells. It was also important to match the water breakthrough seen in Well B-41 of Field B. The fourth field model was built from reliable seismic information, to draw its structure, and by use of average petrophysical properties in the overall model, given the limited amount of data available.
After history matching the reservoir models, a productivity index match was carried out against the matched well models to assure convergence during integrated runs. The parameters compared were static and flowing bottomhole pressures when available, and adjustments were made when necessary.
Well and Network Modeling
It was necessary to model each well and build a network model that represents the actual facility behavior to understand and reproduce operational problems in the system. To do that, 13 wells were modeled with the latest bottomhole-flowing-pressure data available.
The fluid model used was compositional, and a flow correlation matching process was performed to select the best correlation for vertical and horizontal multiphase flow.
A nodal analysis was performed on each well model to understand the potential and was compared with the reservoir-simulation results to reduce convergence problems in the integrated model.
The production-network model was built by use of a compositional fluid model; the boundary condition was pressure.
Compression was considered for only two stages for this evaluation—suction pressure of 600 psi for the first stage and 300 psi for the second—to evaluate different plateaus that decline no more than 25% and can guarantee a minimum duration of 6 months.
Integration
In this phase, all the models are integrated in a single platform to be solved simultaneously at every timestep, considering the boundary conditions downstream and upstream through the whole simulation time.
For this purpose, it was necessary to define the solution-balance method, coupling location, fluid-management strategy, and asset-management strategy.
On one hand, the coupling method considers that the network and the reservoir are solved independently and only boundary conditions are passed in order to achieve a balance. The method is used in the case of multiple reservoirs coupled to a network facility.
On the other hand, the balance method uses well- and group-rate control; the rates of these wells or groups may be defined on the basis of their production potentials.
It is important to consider the coupling location. The reservoir may be coupled to the network at various locations; the most common of these are the top of the hole and bottom of the hole.
When the top of the hole is used, the reservoir-simulation model contains vertical-flow-performance tables describing the pressure loss in the tubing.
Coupling at the bottom of the hole eliminates the need for vertical-flow-performance tables, allowing the network to determine the pressure drop from the bottomhole to the tubing head, which can be more precise than the vertical-flow-performance tables. In this study, the second option was used.
Once all the models are coupled, it is necessary to set all the constraints and considerations that will be applied to the reservoirs during the simulation time in the integrated asset model through the asset-management strategy, which is defined by rules such as group-production-rate control, water/gas-ratio limit, compression capability, and inclusion of new wells. These rules are translated in keywords that are sent to the reservoir model or the network model to be executed.
Evaluation Methodology
As part of the evaluation, it was necessary to generate several scenarios that help answer the questions stated. Six scenarios fulfill the premises defined. Additionally, a base case was considered, which maintains the production plateau with just choke management for as long as possible, finding the best combination of production rate per reservoir and wells.
To identify the optimum production plateau once the compression starts, several runs were performed considering different production plateaus for every stage.
Results
The scenarios were evaluated to verify the duration of the plateau, cumulative gas production, recovery factor per reservoir, and number of compressors.
Even though the reservoirs have different depths and pressures, it was possible to define rates per well and per reservoir that allow simultaneous exploitation, reducing the backpressure effect and maintaining a similar tubinghead pressure behavior for all the wells of the system.
The benefit of the compression in terms of recovery factor is an increment of 14%, reaching a total recovery factor of 79%.
The total compression cost is very low compared with the total cash flow; it does not have a large effect on net present value. Moreover, the total cost of compression could be repaid within 2 months after the beginning of the first compression stage.
In all the scenarios, the renting option for compression was always more profitable than the buying option.
This article, written by Special Publications Editor Adam Wilson, contains highlights of paper SPE 169918, “A Case Study of Integrated Asset Modeling To Support Reservoir-Management Strategies for Four Dry-Gas Fields Sharing Production Facilities,” by O. Espinola, SPE, M. Rocha, SPE, and N.C. Alvarez, SPE, Schlumberger, and J.R. Ramirez, A. Solis, and J.D. Guzman-Arevalo, Pemex, prepared for the 2014 Trinidad and Tobago Energy Resources Conference, Port of Spain, Trinidad and Tobago, 9–11 June. The paper has not been peer reviewed.