Biological-monitoring programs provide data for decision making and to ensure the protection of resources. However, in tropical ecosystems that are home to most of the planet’s biodiversity, these programs need to be improved in design and implementation. Block 57 in the Amazon rain forest of southern Peru is an ecosystem with limited information. A systematic biological-monitoring program was designed on the basis of a gradient of disturbance caused by clearing an area.
Introduction
Oil exploration in Block 57 involves clearing small forest areas during installation of drilling platforms. One of the consequences of this clearing is an increase of edges and the presence of habitats with early successional stages. An edge is defined as a transition zone between two adjacent ecosystems or vegetation communities. In these edges, deleterious effects may be generated.
A biological-monitoring plan has been designed as part of an environmental-management plan to understand the effect that the changes in the habitat associated with the exploratory wells within the primary cloud forests have on the abundance, richness, and diversity of the local flora and fauna.
Study Area
Block 57 is on the southern Amazon plain and the first foothills of the eastern slope of the Peruvian tropical Andes Mountains (Fig. 1). This is one of the areas with the greatest precipitation and highest temperatures and relative humidity in Peru. At several locations, total annual precipitation exceeds 3000 mm. Relative humidity exceeds 90% in the mornings, and temperatures commonly exceed 37°C in the afternoons during the dry season when the sky is clear.
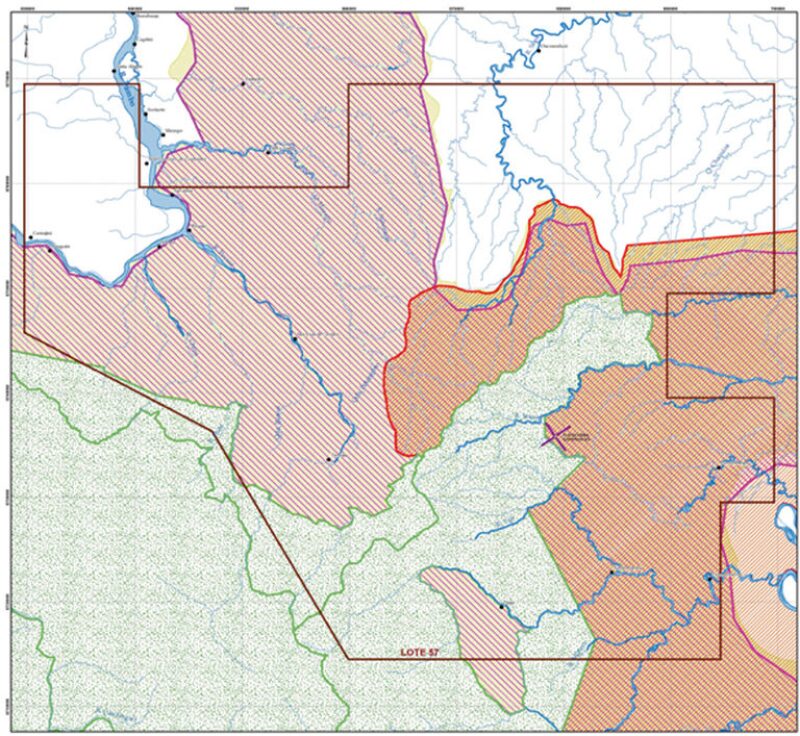
The study area is in the buffer zones of the Otishi National Park and the Ashaninka and Machiguenga Community Reserves. It is predominantly hilly, with mountainous areas in the western sector and terrace areas near the Tambo and Urubamba rivers. Floral composition in the study area is very heterogeneous with different densities. Palm trees are another representative and varied group in these forests, sometimes rising above the canopy.
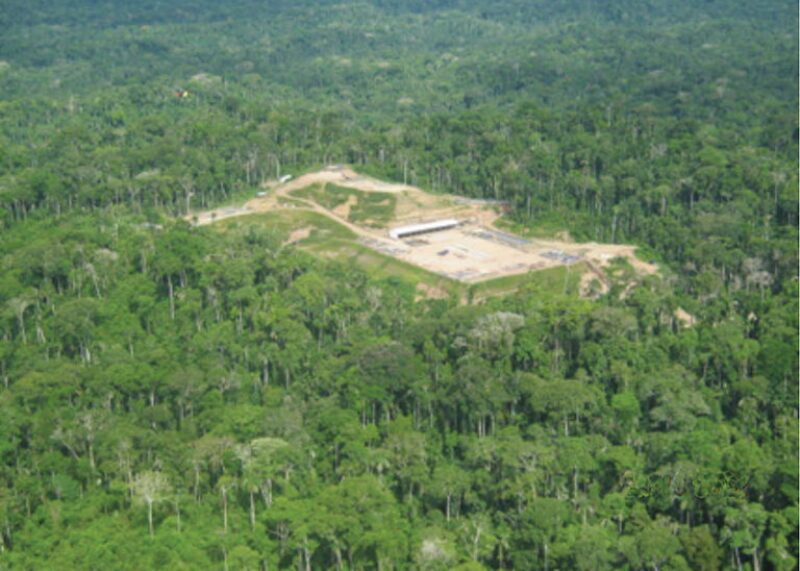
The work design includes three platforms in Block 57—Kinteroni BX, Mapi LX, and Mashira GX. This study includes the results of monitoring conducted on the surroundings of the Kinteroni BX exploration platform, also known as Sagari (Fig. 2).
Methods
Evaluations were developed for the following exploration stages: construction, drilling, and abandonment. As part of the biological-evaluation design, four transects or main lines were defined on the basis of the locations of the different sampling zones for each of the biological components. The sampling units for each component were located on each of these transects at constant distances from the vegetation edge (Fig. 3).
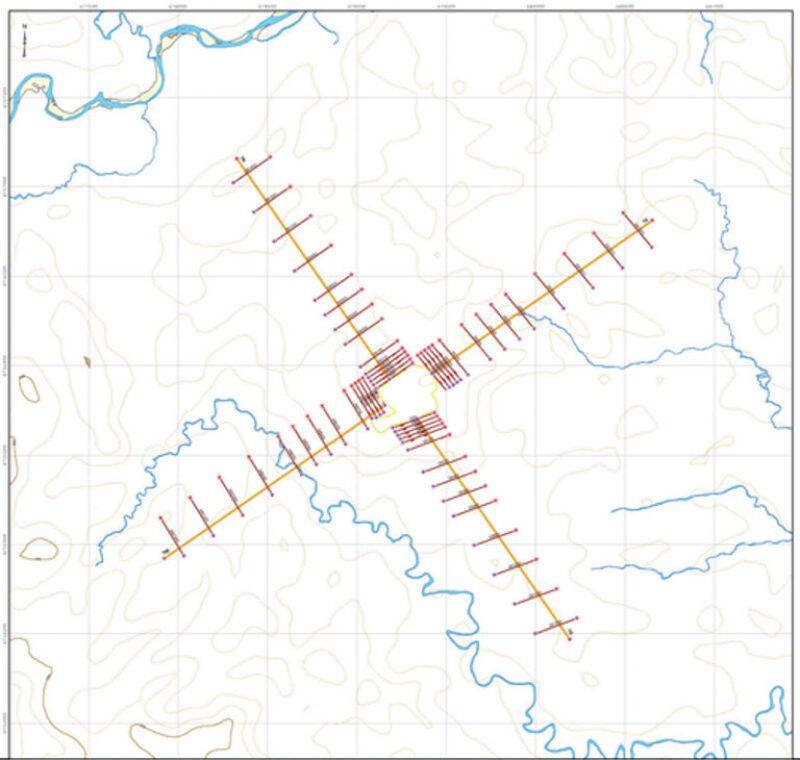
To evaluate the edge effect on the flora and fauna, the sampling units were placed on strips (i.e., 250- to 300-m-long transects) at varying distances. This way, the vegetation and arthropod components were evaluated at a small scale (i.e., strips placed ≤150 m from the cleared area), whereas small-mammal, reptile, and bird components were evaluated at mesoscale (i.e., strips placed ≤600 m from the cleared area).
For the vegetation and arthropod components, five strips were placed between 0 and ≤150 m from the deforested area. In the case of birds, mammals, and reptiles and amphibians, five strips were defined between 0 and ≤600 m from the deforested area, while, for the reptiles and amphibians and birds, one or two strips were added to increase the sampling strength and to meet the theoretical suppositions of the methodologies used.
To obtain quantitative vegetation data, 200-m2 (10×20-m) sampling plots were installed and, within each of the plots, four 1×1-m subplots were placed. These plots were established in eight transects around the deforestation area. In each transect, five plots were established 0, 25, 50, 75, and 100 m from the deforested-area edge. To obtain arthropod records, three sampling methods were used: pitfall traps, aerial interception traps, and light traps. Sampling stations were distributed according to a scheme similar to that proposed for vegetation except for the maximum distance, which was 150 m.
For the recording of birds, small mammals, and reptiles and amphibians, four perpendicular transects were placed on each side of the platform area. On these transects, five strips (small transects) were distributed at 0, 50, 150, 300, and 500 m from the deforested area, and an additional strip at 400 or 600 m for the reptiles and amphibians and birds. Sampling strength was between 318 and 240 counting points. For sampling small land mammals, 20 stations were placed on each strip 10 m from one another. For small flying mammals, two 12-m-long×2.5-m-high fog nets were placed on each strip. The nets were open between 1800 and 2200 hours, and the sampling strength was 220 nets/night. Reptile and amphibian recording was performed on small transects (50×2 m) by use of a visual encounter survey. A total of 168 small transects were evaluated, and both day and night evaluations were performed.
For each taxonomic group, the following was estimated: species richness, abundance, Shannon-Wiener diversity index, and Pielou equity. In the case of vegetation, vegetation cover and Margalef richness were also estimated.
To determine the edge effect on arthropods, abundances of families of the Diptera and Coleoptera order were determined and used to calculate the richness and diversity, which were correlated with the distance to each strip by use of the Spearman correlation coefficient. Furthermore, principal-component analysis was used to determine which of the families and functional groups of Diptera and Coleoptera contributed most to variation between sampling strips. The families and functional groups with the greatest variation were correlated with the distance to each strip by use of the Spearman correlation coefficient. In the case of birds, the edge effect was evaluated by comparing the averages of 12 parameters and distance to the edge. As in the case of vegetation, the Spearman coefficient was used to correlate five community parameters (richness, abundance, vegetation cover, Shannon value, and Margalef richness) with the distance to the edge used. Finally, the edge effect on small mammals and reptiles and amphibians was evaluated with the Jaccard similarity index.
Results
Small-Scale Evaluation. Small-scale evaluation included the results obtained for the arthropods and vegetation components. These components are characterized by their high complexity and diversity, which, in the case of arthropods, determined the choice of objective groups that could serve as indicators. For this purpose, taxa were chosen that met the following requirements: moderate to high abundance, high capture frequency, high taxonomic diversity, and high functional diversity (i.e., inclusion of families and species with different feeding habits). On the basis of these requirements, the Diptera and Coleoptera orders were selected as representative of the arthropods present in the soil and the understory.
The sampling effort used during the three monitoring rounds was adequate to estimate the total number of Diptera and Coleoptera families present, because estimated richness percentages obtained fluctuated between 87 and 94%. In the case of vegetation monitoring, the sampling strength allowed for monitoring between 60 and 65% of the richness present.
Once the main parameters that induce variability between strips were determined, the researchers studied whether proximity to the Kinteroni BX platform caused changes in diversity, composition, or functionality of the biological components. In the case of the arthropods, for each strip, the following community parameters were calculated: richness, Shannon-Wiener index, relative Phoridae abundance, relative Staphylinidae abundance, relative predator abundance, relative saprophage abundance, understory arthropod abundance, and soil arthropod abundance. These values were correlated with the distance to each strip by use of the Spearman coefficient. In this case, of the eight evaluated parameters, only richness was significantly related to the distance to the platform edge.
As for vegetation, the following community parameters were calculated: vegetation cover, abundance, richness, diversity, and average shrub--species abundance. Among these, richness showed a positive correlation during the initial construction phase, whereas the average shrub-species richness was negative during the abandonment phase.
Mesoscale Evaluation. Mesoscale evaluation included the results obtained for the birds, small mammals, and reptiles and amphibians. In the case of small mammals and reptiles and amphibians, abundance values of zero were obtained in many of the sampling units because the species accumulation curve did not reach the asymptote. The opposite happened in the case of the birds, where the effort used during the three monitoring rounds was appropriate to characterize the richness of the location.
For birds, the Spearman correlation test was used to establish a possible relation between the community variables and the distance to the Kinteroni BX platform. Through this test, 12 parameters were evaluated, ten of which—abundance, richness, Shannon diversity, insectivore abundance, omnivore abundance, insectivore richness, omnivore richness, frugivore abundance, frugivore richness, and taxonomic diversity—showed significant positive correlations with distance to the platform edge during the drilling phase. During the construction and abandonment phases, there was no significant correlation between these parameters and the distance to the edge, except for the abundance and richness of frugivores, which showed significant negative correlations with distance.
Conclusions
Small-Scale Evaluation. At small scale, the arthropod and floral communities, in different population and community parameters showed evidence of influences from the exploration activities.
In the case of the arthropod community, the Coleoptera and Diptera orders were used as indicators. Within these orders, the Phoridae and Staphylinidae, as well as the phytophage, saprophage, and predator groups, generated the largest variability between the strips. These results suggest the importance of further investigation regarding how these groups respond to the changes in the habitat.
In the case of the floral community, the sample effort explained only 60–65% of the expected richness for vegetation, and, therefore, the sampling design for this community will have to be adjusted for better data interpretation.
Mesoscale Evaluation. Mesoscale evaluation generated a response to the degree of influence from the exploration activities only in the bird community. Of all communities evaluated, this community reflected the best correlation with the distance to the platform, which made it an excellent indicator. Regarding frugivores, this group showed a variable correlation pattern, being positive during the second monitoring and negative during the third monitoring. These results do not allow for conclusions about the use of this functional group as a bioindicator of edge effect.
During the study, no response was found from the small-mammal and reptile and amphibian communities to changes in the habitat during exploration.
This article, written by Special Publications Editor Adam Wilson, contains highlights of paper SPE 165632, “Validation of a Biological-Monitoring Design in Highly Diverse Tropical Forests,” by K. Caro, E. Enriquez, E. Juscamayta, E. Oyague, and J. Cabrera, Knight Piésold, and C. Chung, C. Ahumada, A. Watson, and C. Videla, Repsol, prepared for the 2013 SPE Latin American and Caribbean Health, Safety, Social Responsibility, and Environment Conference, Lima, Peru, 26–27 June. The paper has not been peer reviewed.