
You have invested a lot of time and money training new employees. Once employees are fully qualified, how do you retain them? The SPE Talent Council survey on factors affecting employee attraction and retention provides valuable insights. Documented in paper SPE 168112, the survey received responses from 1,737 people, and the results indicated that for those surveyed there are many important ways in which younger employees differ from older ones and that key retention factors differ with age.
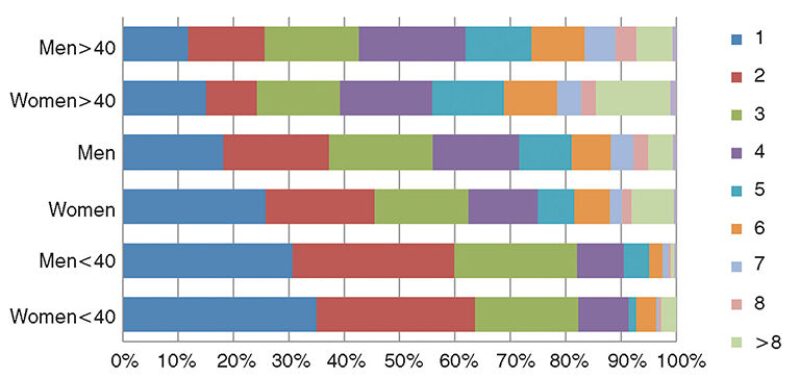
Survey respondents were asked to rate 31 factors for staying with an employer and 31 factors for leaving an employer on a 6-choice scale that ranged from “most important” to “not at all important” and “not applicable.” Only people who reported having more than one employer were asked questions about leaving. Most of the survey respondents had worked for multiple employers (Fig. 1). Once people have experience switching employers, it may take less provocation or less enticement to persuade them to make another change.
For survey respondents, “golden handcuffs” were not very effective. “To qualify for a future benefit such as a pension or retiree medical coverage” ranked 15th out of 31 factors for staying for men over the age of 40, 22nd for women over age 40, and 26th for men and women under age 40.
Opportunity’s Siren Call
Opportunity was clearly the number one driver, but the results indicated the intensity of that driving force varies with age and gender. When people were asked to rate factors for leaving an employer, 53% of women and 49% of men under the age of 40 identified “insufficient opportunity, challenge, career potential” as “most important,” in comparison with 35% of women and 29% of men over the age of 40. When the question was worded “Why do you stay with an employer?” 53% of both men and women under age 40 identified “opportunity, challenge, career potential” as “most important,” in comparison with 39% of women and 32% of men over age 40.
Opportunity, while clearly of paramount importance, was only part of the answer. The top factor captures 7% to 8% of the “most important” responses for why survey respondents stayed, and 10% to 12% for why they left (Fig. 2). Capture of 50% of the “most important” responses for why survey respondents leave requires seven to eight factors. Capture of 80% of the “most important” responses for why people leave takes 15 to 16 factors. The results of this survey indicated that for companies to have attrition rates below 20% requires attention to many factors.
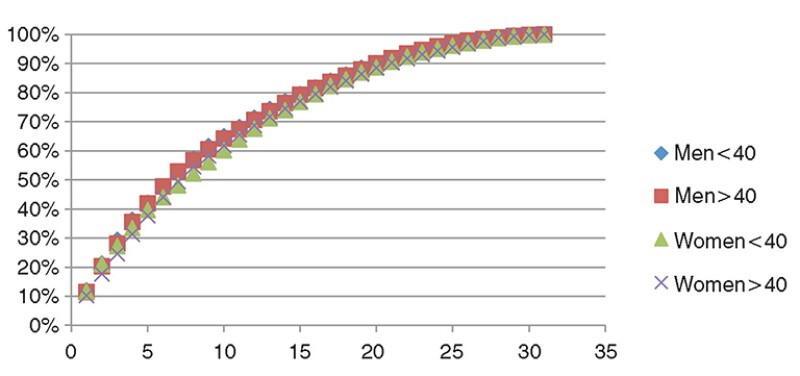
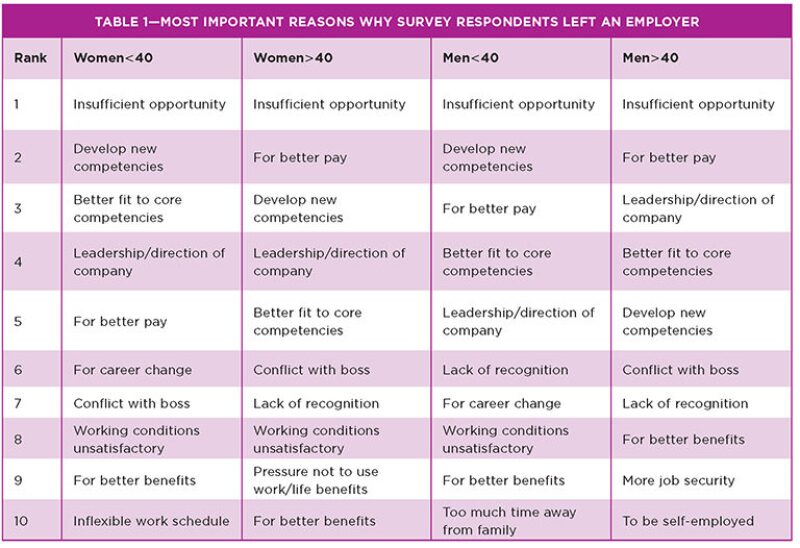
Table 1 provides in ranked order the top reasons survey respondents gave for leaving an employer. To capture the top 10 reasons for these four groups, 14 factors are needed, which still only capture about 60% to 65% of the “most important” reasons why survey respondents left an employer.
Attraction and retention of employees is not a simple issue and depends on individual situations. The questions about why people left received far more “not applicable” responses than those asking why people stayed. Some of the questions with the most “not applicable” responses were among the strongest drivers for those to whom the question applied. If a survey respondent was dealing with a conflict with their supervisor or coworkers, that became a very powerful motivator to leave.
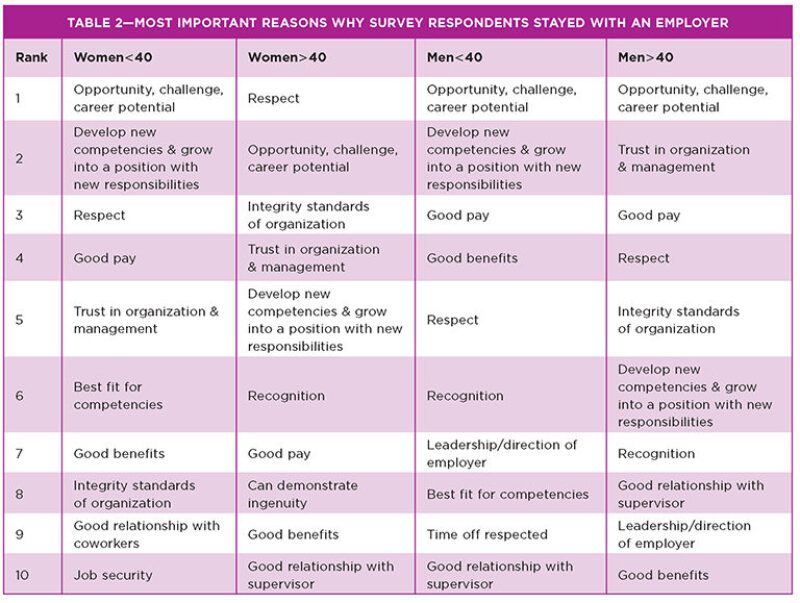
There were far fewer “not applicable” responses as to why survey respondents stay with an employer and more factors are needed to capture 50% of the “most important” responses. Table 2 lists in ranked order the top reasons that people gave for staying with an employer. To capture the top 10 reasons for these four groups, 15 factors are needed and they capture about 60% to 65% of the “most important” reasons that people cite for leaving an employer. With regard to reasons both for leaving and for staying, younger women spread their responses between more factors that are “most important” for them than other groups, so the top 10 factors captured 60% of younger women’s “most important” reasons for leaving and 47% for staying. Attraction and retention of older men is not simple, but the responses were more concentrated. Older male respondents cited far fewer reasons and 10 factors capture 64% of their “most important” responses for leaving and 55% for staying. The survey results indicated that for companies to transition smoothly during the big crew change means paying attention to a wider range of employee concerns.
Good pay was among the top seven reasons for staying for all of these groups, but was not as highly ranked a retention factor for women as for men, especially for women over age 40.
Priorities Change with Age
Age differences showed up in both career focus factors and work/life balance issues (Fig. 3 and Fig. 4). “Lack of training” was much more important for younger respondents. Both younger men and younger women were much more likely to leave than older respondents because of inflexible schedules and too much time away from their family. Older people were much more likely to leave to avoid relocation. These survey respondent demographic differences provide insight into which types of employees could be motivated to leave because of different actions taken by a company.
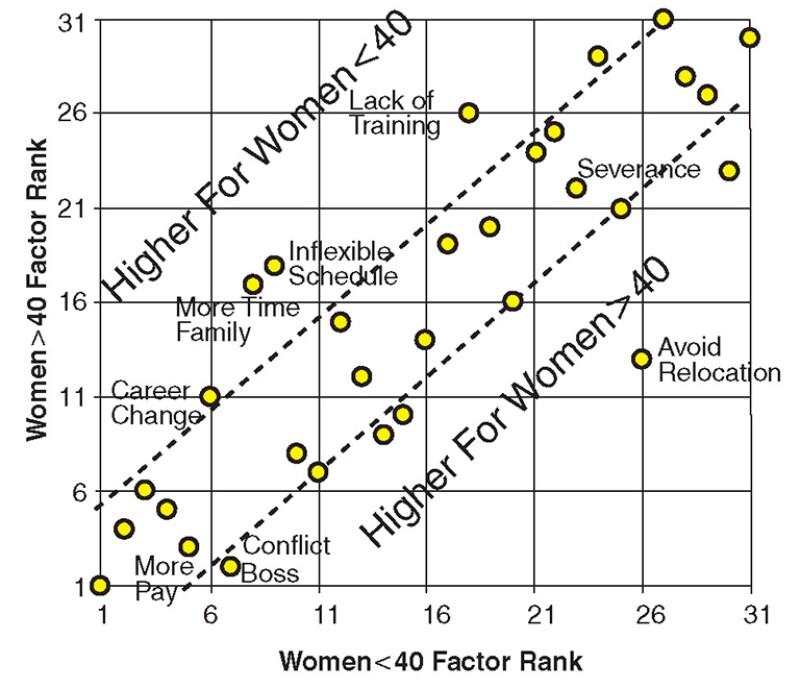
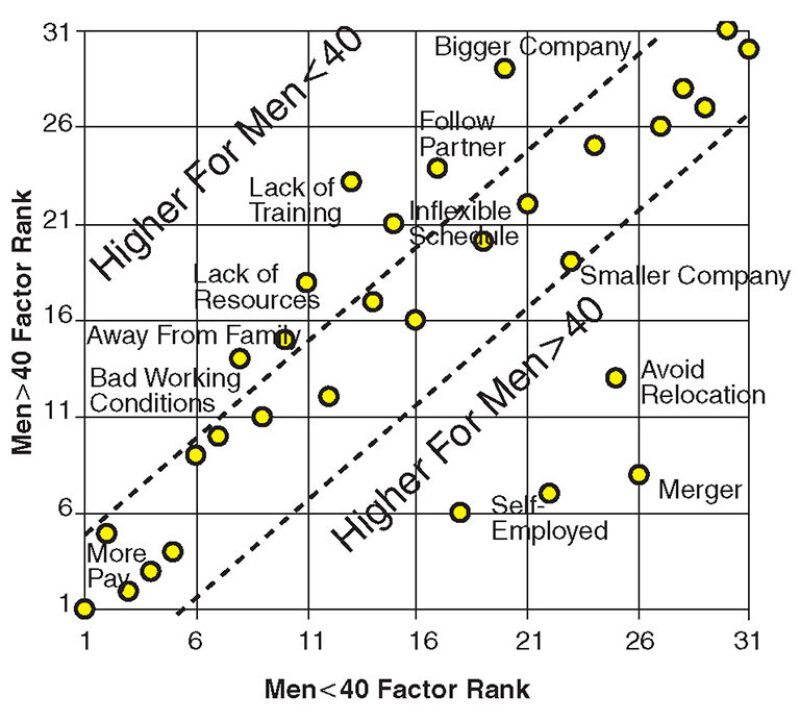
Older male survey respondents listed no work/life issues in their top 10 reasons for leaving, but the other three groups did. “Too much time away from family” was 10th in younger men’s ranking of reasons for leaving and “time off respected” was 9th on their list for staying. This result could indicate that with the big crew change, work/life benefits will take on increasing importance in attraction and retention of employees.
“Conflict with supervisor” was among the top seven factors for younger women, older women, and older men, but not younger men. “Conflict with supervisor” was the seventh most important reason for younger women and the 16th reason for younger men.
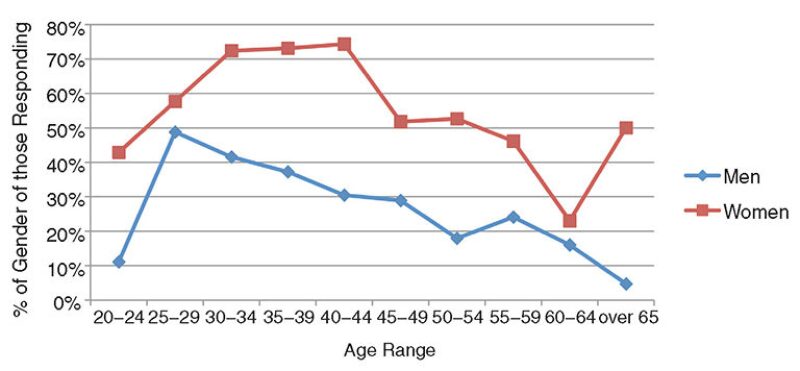
A comparison between Figs. 3 and 4 indicates more significant differences with age for men than for women. The reasons for these larger differences may be that younger male respondents were much more likely than older male respondents to be part of a couple in which both partners work full time (Fig. 5). The figure shows that the percentage of male survey respondents who are part of a dual-career couple increases the younger they are: 49% between ages 25 and 29 belong in this group. The majority of female survey respondents between ages 25 and 54 are part of a dual-career couple.
Conclusion
The results of all three SPE Talent Council surveys (the current survey and the two previous ones) indicate that following the big crew change, sole breadwinners who are part of a couple will likely be a much smaller percentage of the workforce than they are today. A large and growing percentage of the workforce will likely be one in which both spouses work full time. To attract and retain younger employees, work/life policies might need to place a premium on flexible work schedules and more time with family. With age, opportunity, while remaining important, could become less alluring. It would appear to be more difficult to persuade older people to relocate.
References
Sprunt, E., Howes, S., and Pyrcz, M. 2013. Attraction and Retention of Employees, Results of 2013 SPE Talent Council Survey. Paper SPE 168112.
Sprunt, E., Howes, S., and Capello, M.A. 2012. Bridging the Generation Gap, J. Pet Tech. 64 (5): 80–81.
Sprunt, E. and Howes, S. 2012. Factors Impacting Dual-Career Couples, Results of the December 2011 Talent Council Survey, TWA 8 (2): 6–9.
Sprunt, E. and Howes, S. 2012. Factors Impacting Dual Career Couples, Results of December 2011 Talent Council Survey. Paper SPE 160928.
Sprunt, E. and Howes, S. 2011. Results of Dual Career Couple Survey. J. Pet Tech. 63 (10): 60–62.
Sprunt, E. and Howes, S. 2011. Dual Career Couple Survey Results. Paper SPE 151971.

Eve Sprunt, a consultant, has 35 years of experience working for major oil companies. She was 2006 SPE President and was made an Honorary Member of SPE in 2010. In 2013 she was honored by the Society of Women Engineers with its Achievement Award, their highest award. She holds degrees from the Massachusetts Institute of Technology (Earth and Planetary Sciences) and earned a PhD in geophysics from Stanford University.

Susan Howes is reservoir management organizational capability consultant at Chevron, a petroleum engineering graduate of The University of Texas, and an SPE Distinguished Member. Howes currently serves as chair of the SPE Soft Skills Committee, was the 2010 chair of the SPE Talent Council, and is past president of the Chevron Women’s Network.
Michael Pyrcz is a research scientist and team leader with Chevron Energy Technology Company. He completed a BS degree in mining engineering and a PhD in geostatistics at the University of Alberta. He has published more than 25 peer-reviewed publications and recently completed a textbook on geostatistics for Oxford University Press.