
Today’s field developments are increasingly characterized by complex wells in demanding and costly operating environments. Not only are individual wells challenging, but most are part of a complex reservoir network that must be managed over an extended period.
The high cost and risk of acquiring reservoir surveillance information using conventional technology, such as production logging tools, is forcing operators to manage these fields without knowledge of the inflow distribution across the reservoir interval. In addition, permanent reservoir surveillance solutions based on optical or electronic sensors require major modifications of the completion design and installation procedure. Consequently, a significant amount of complexity and risk are added to the project, making the use of such technologies prohibitive.
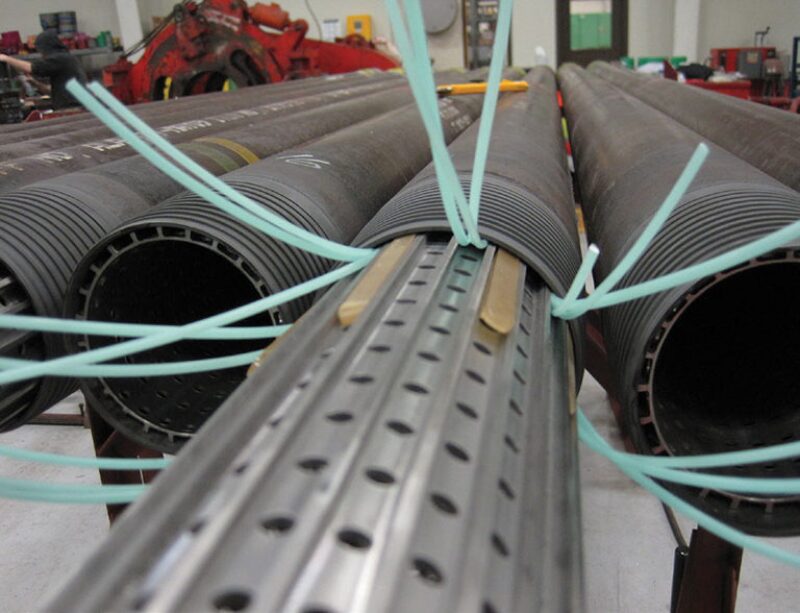
Intelligent chemically based inflow tracer systems are an emerging technology that consist of engineered polymers and chemical compounds combined into a product that resembles strips of plastic. The tracer system is designed to react to either oil or water. For example, when a water-sensitive tracer system is contacted by water, the tracer system releases its unique chemical identification (inflow tracer) at a prescribed release rate, irrespective of the flowing conditions. The water-sensitive tracer system is dormant when contacted by oil, gas, or air. The oil-sensitive tracer system behaves similarly as the tracer is released only when it comes in contact with oil.
Strips of the tracer system are readily integrated into almost any completion configuration including conventional sand screens, inflow control device (ICD) sand screens, multistage fracturing systems, pup joints, and intelligent completions. Additionally, the tracer system can be cemented behind casing and perforated through, providing contact between reservoir fluids and the intelligent tracer strips. In summary, the intelligent tracer strips can be deployed in almost any well type without affecting the installation process.
Samples of produced fluid are analyzed for the concentration of each intelligent tracer. Tracer concentration data, combined with model-based interpretation techniques, enables the operator to understand where oil is entering the well, where water influx is occurring, and relative oil contributions of monitored zones.
The technology has been deployed onshore and offshore in locations such as Alaska, the North Sea, Australia, west Africa, and the US Gulf of Mexico. Operators have benefited from this technology by gaining insight into inflow distribution without having to run a production logging tool (PLT) log or needing to perform complex and risky completion design modifications to accommodate electronic or optical sensors across the reservoir.
Key benefits of the technology include the following:
- Minimum implementation risk: It does not require cables, connections (wet mates), or well intervention. Additionally, there is minimum impact to existing completion design.
- Cost efficiency: There is no additional rig time or personnel required on site to run the completion. This is because the system integration is done ahead of time during manufacturing or where the inventory is located.
- Health, safety, and environmental (HSE) compatibility: The technology does not use radiation and is HSE-compatible for water discharge in extremely low concentrations (down to parts per trillion).
Examples of insight that intelligent tracers have provided include the following:
- Multizone fracture analysis that showed some zones were not producing and behind-pipe flow was occurring in other zones
- Location of water influx as it changes over time
- Evidence of flow contribution from the toe of a long horizontal well
- Poor contribution from one lateral of a multilateral well
- No flow coming from intervals thought to be productive
- Flow detected from downhole sliding sleeves thought to be closed
- No flow from sliding sleeves thought to be open
- Assurance that remotely activated sleeves actuate as expected
Location of Water Influx
It is common for a well to start producing water at some point during its life. Knowing the location in the well where the water is coming from is valuable information for improved management of the reservoir.
Intelligent inflow tracers can prove useful in this application. They are designed to release their unique chemical compound only when contacted by water. This feature allows the life of the water tracer system to be significantly extended as none of the tracer is being released during the time the tracers are in contact with oil.
Fig. 1 illustrates an example of using intelligent inflow tracers for water breakthrough detection. In the figure, each vertical line represents the location of a joint of screen that contains intelligent tracer. Each color represents a unique chemical compound contained in the tracer system.
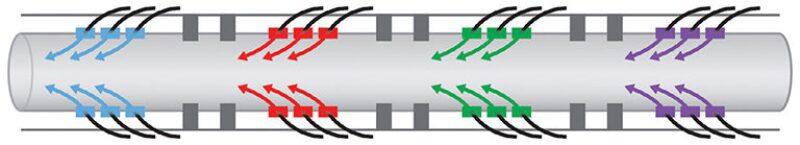
If water is produced from one of these intervals, it will contact the tracer system in the screen, causing the chemical compound to be released.
Samples of the produced water are analyzed and the concentration of the tracers provides insight into where water production has occurred along the reservoir interval.
Fig. 2 shows a plot of the water tracer concentration data for samples taken over 3 months. The colored lines correspond to the colors of the intelligent tracers in Fig. 1. The grey dashed line is the water cut during the time period measured from a multiphase flow meter and is plotted against the right axis. Point A in Fig. 2 identifies the point in time when a sharp rise in the concentration of the tracers occurred, designated by the blue color. A corresponding change in the slope of the water cut is also observed. The conclusion is that the rise in water cut at this point in time occurred in the blue zone.
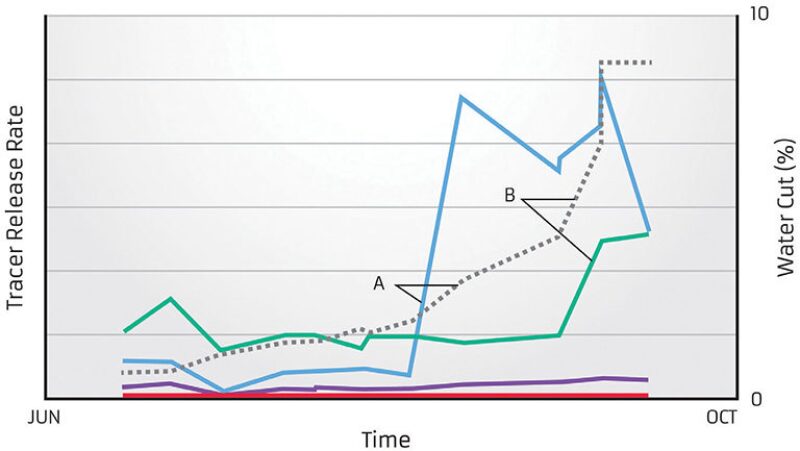
Point B identifies a sharp rise in the concentration of the green tracer. A corresponding rise in the water cut curve is also detected.
The location of water breakthrough information is used to improve the understanding of the overall flow dynamics in the reservoir and also to verify that the multiphase meter is calibrated to provide accurate information. This information can be used to improve recovery by modifying future well-location, completion-technique, or waterflood operational strategies. Wells can be designed such that intervention operations can shut off water-producing zones remotely or by intervention operations.
Inflow Distribution Assessment Using the Flush-Out Model
Fig. 3 illustrates a technique in which the tracer system strips are integrated into an ICD-style sand screen during the screen manufacturing process. The screens are installed in the well as normal practice and positioned across the reservoir section. When the tracer system strips come in contact with oil, tracer molecules are released from the tracer system.
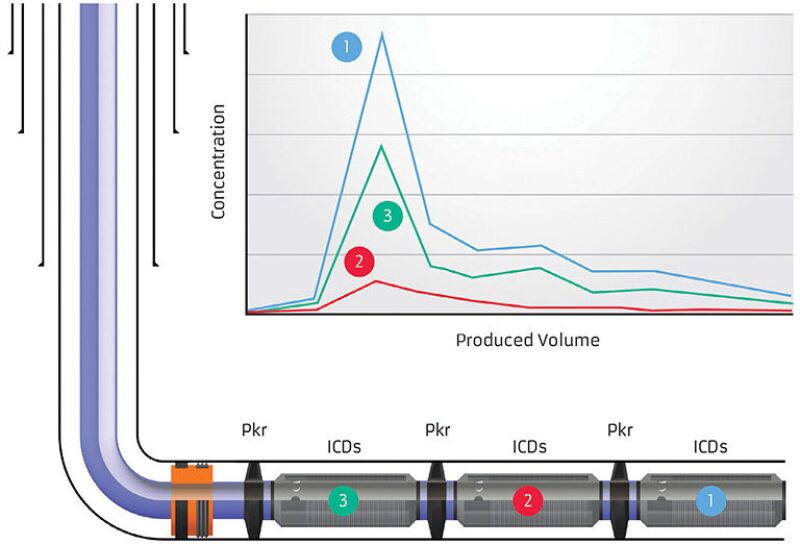
During a shut-in period, the tracer system continues to release the tracer even when there is no flow. The oil immediately surrounding the tracer system strips acquires a high concentration of the tracer chemical. When the well is turned on, the oil with the high concentration of tracer is flushed out of the screen and into the main flow stream of the well.
An analysis of samples taken at regular intervals at the surface will detect the rise and fall of tracer concentration as the oil that contains the high tracer concentration is produced to the surface. The shape of this plot is indicative of the productivity of the interval being monitored. The response is best when isolation packers are used to ensure the response is from the zone of interest. The rate of rise and fall in concentration is compared among all the monitoring locations. The more prolific zones will flush out the ICD faster and will therefore, exhibit a sharper rise and fall in concentration when compared with the less prolific zones.
The example shown in Fig. 3 illustrates this behavior. The character of the curves indicates that Zone 1 is the most prolific contributor. Zone 2 is a minor contributor.
This behavior has recently been studied in a flow loop using full-scale completion components. This testing is being performed at a multiphase flow facility operated by the Institute for Energy Technology in Norway. The testing is being conducted as part of a joint industry project that includes two North Sea operators.
The results of the flow loop testing have verified the validity of the tracer decline rate as a direct indicator of inflow compared with the decline rate of other zones in the well. The accuracy of a proprietary mathematical model that converts the decline rate of tracer concentration to percentage of total well flow also has been confirmed, thereby providing a quantitative inflow analysis of each zone.
The accuracy of this method is dependent on good displacement efficiency; therefore, the best results will be obtained when single phase fluids are present. Significant amounts of water or gas will alter the effectiveness of the flush out. The effect of multiphase fluids on the tracer decline is the focus of ongoing flow loop testing and research and development work.
It should be noted that even in situations when inflow conditions are not ideal for quantitative analysis, there are rarely any viable alternatives for acquiring “across-the-reservoir” surveillance information. Intelligent tracer technology will still provide qualitative insight into each zone’s performance.
With this knowledge, the operator can assess potential reasons for the difference in production and feed this insight into the reservoir simulator to improve reservoir understanding.
The Tracer Shot Model
As described earlier, the tracer system releases the tracer chemical when it comes in contact with its target fluid, oil, or water. When the well is static, the concentration of the tracer increases in the fluid in the immediate vicinity of the tracer system. The previous example illustrated how this effect can be used to determine relative inflow distribution when the tracer system is placed in an annular area that is connected to the main flow stream.
Another technique is to deploy the tracers in the main flow stream instead of an annular area.
The oil that is on the inside of the mandrel develops an increased concentration of the tracer during shut-in periods. When the well is turned on, this oil is displaced directly to the surface. By deploying several carrier mandrels containing unique tracers at various locations in the well, the difference in produced volume between the arrivals of these slugs of fluid (referred to as “tracer shots”) is used to determine the inflow distribution. Fig. 4 illustrates the location of tracer carriers in a multilateral well.
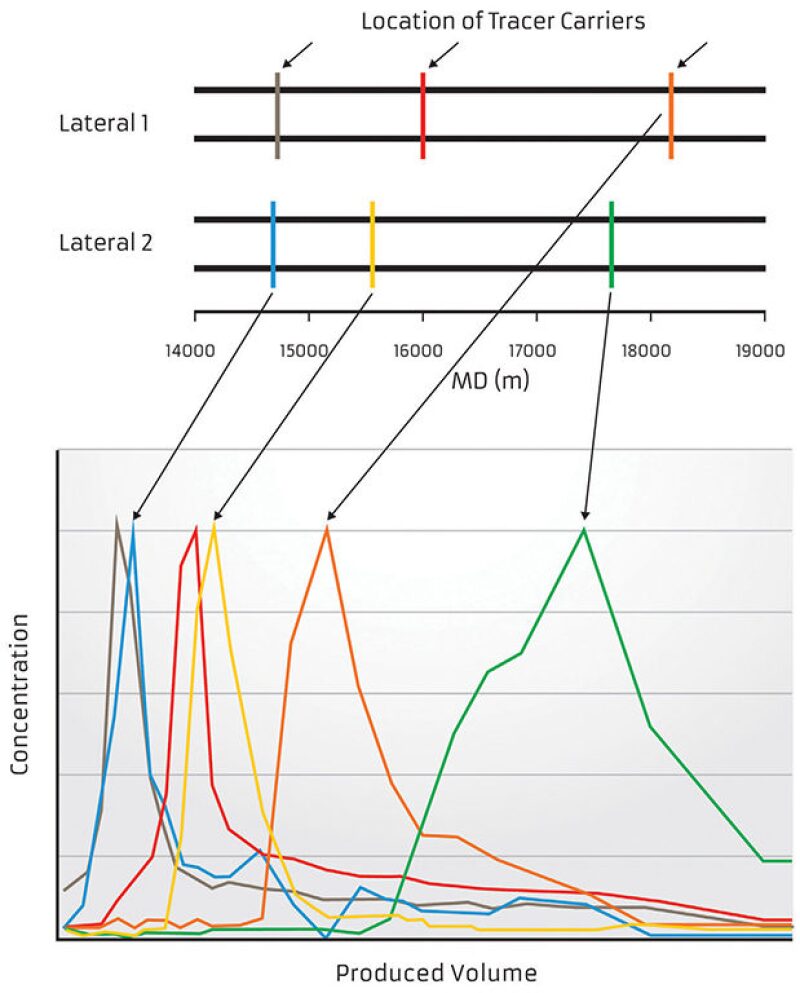
During a brief shut-in period the intelligent tracer shots are developed at each carrier location. The well was turned on and sampled at a frequency of 4 samples per hour during the few hours that the tracer shots were expected to arrive at the sample point.
The tracer shot arrival technique does not use the decline rate of the tracer concentration, only the produced volume when each peak of tracer concentration arrives at the sample point. To facilitate determination of when the peak concentration arrived at the sample point, the tracer concentration data is normalized. Fig. 4 shows the normalized concentration data of each of the tracers plotted against the produced volume associated with each sample. The spacing between the concentration peaks is a function of the inflow distribution across each lateral. A simulator is used to work out the inflow distribution that would create this arrival pattern.
Fig. 5 illustrates the good correlation achieved by the simulator after several iterations were performed to match the actual arrival of each peak with the simulator’s predicted arrivals, which are represented by the dashed lines. The inflow distribution that creates this correlation is shown in the upper portion of the figure as a percentage of total flow.
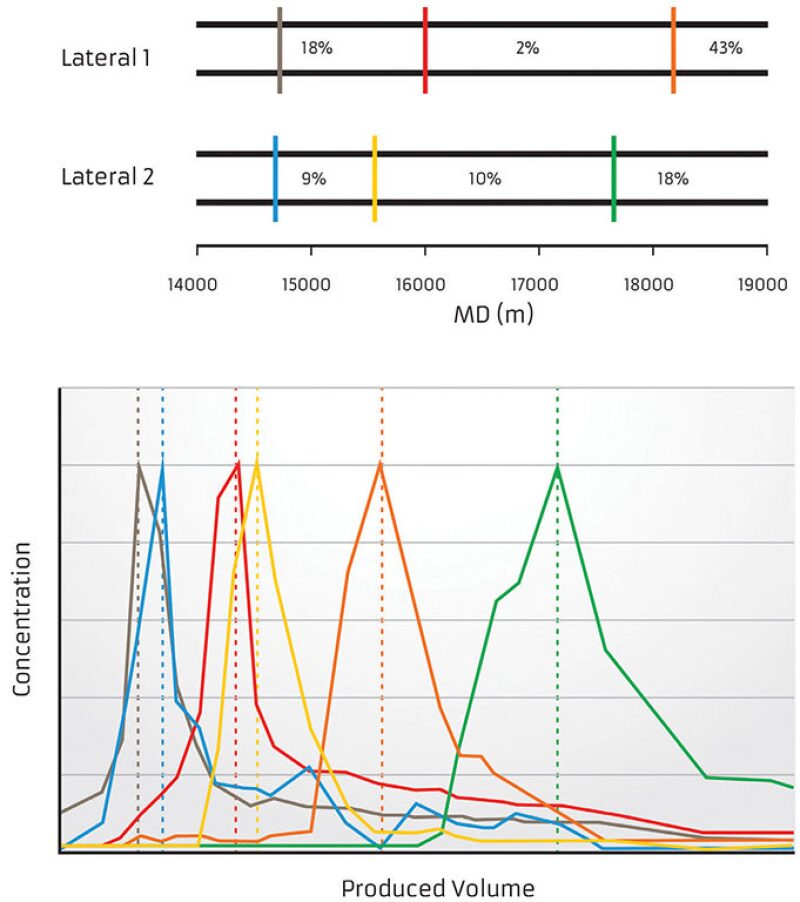
This analysis indicated several interesting features including the observation that 43% of the flow is originating from the toe of the upper lateral. Knowledge of the inflow distribution of each lateral is useful in designing the placement and design of future wells to optimize recovery.
Conclusions
- The management of reservoirs is made more challenging by the difficulty in obtaining reservoir surveillance information from complex wells in high operating cost environments. In many cases, there is no “across-the-reservoir” inflow distribution surveillance information obtained for the life of the field.
- Intelligent tracer technology can be deployed in a variety of forms and methods that have a minor impact on completion design and effectively no additional risk to the overall success of the well.
- Intelligent tracers have shown the ability to provide inflow distribution information in a variety of situations that otherwise would have proved impractical to obtain.