
The Montney formation in Canada is one of the largest resource plays in North America. Horizontal multistaged fracturing is the best method for developing this vast resource. Before hydraulic fracturing of the wellbore, the toe stage is frequently minifractured to obtain reservoir and geomechanical properties. Various pressure-transient-analysis (PTA) -based interpretation techniques have been introduced to the industry over the last few years for the determination of closure pressure. From a theoretical viewpoint, unification of the fields of traditional PTA and minifracture interpretation has been achieved.
Introduction
Despite low natural-gas prices, the Montney-play region of northeast British Columbia remains one of the most active of such plays in North America. Operators continue to push drilling activity in the Montney, with increased liquids production within many portions of the trend. Characterization techniques and stimulation and production mechanisms continue to make economics favorable. Prefracture diagnostic testing is an approach that regulators and operators are now more commonly using in unconventional and tight formations. Industry’s current use of minifracture analysis for the determination of fracture closure and after-closure reservoir properties, however, still presents several challenges.
The conventional approach to all minifracture analysis is the 1D Carter leakoff model, which leads directly to the concept of G time. For more than 30 years, G time (or the G-function) has played the dominant role for the determination of closure stress, but there remains ambiguity in performing minifracture analysis. Part of the problem is that the recommended plots do not rigorously identify the various flow regimes that occur during a minifracture/falloff. Minifracture analysis requires a general theory that accounts for all of the actual observed flow regimes (both before and after closure).
The objective of this paper is to create and perform a consistent workflow process of four Montney diagnostic injection tests (one vertical and three horizontal wells) on the same pad, with a systematic approach highlighting the characteristic flow-regime slopes when using the Bourdet log-log derivative plot. In brief, the Bourdet derivative function used in the PTA-based log-log derivative approach accounts for rate variation before the analyzed shut-in period. The workflow we present is also dependent upon plotting the primary-pressure derivative (PPD) in combination with the Bourdet log-log derivative plot.
Overview of Flow-Regime Identification in Minifracture Analysis
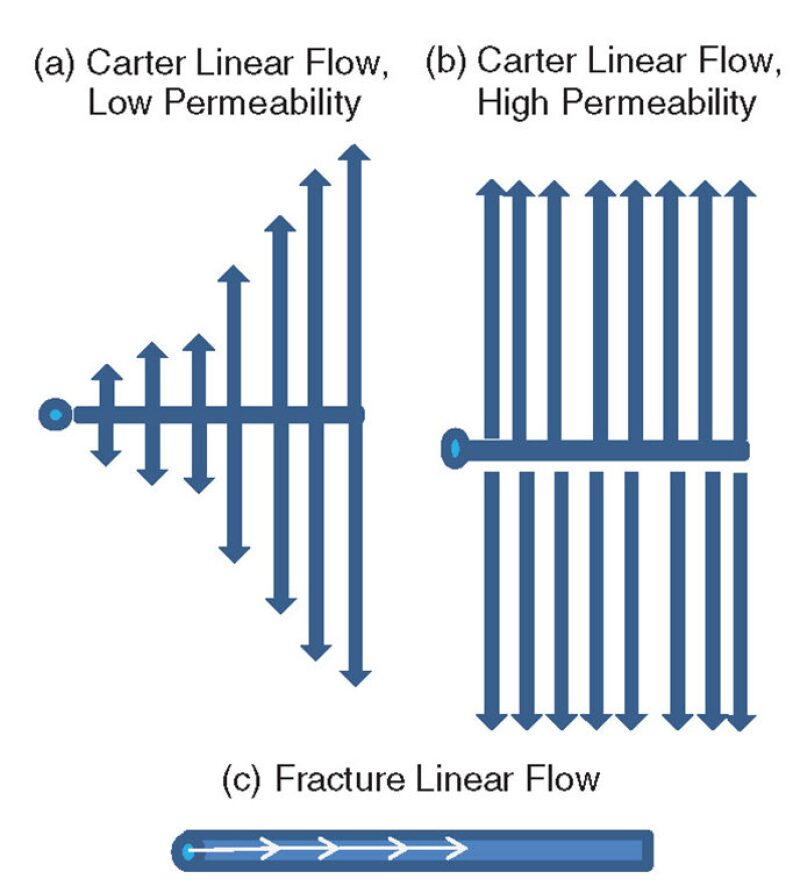
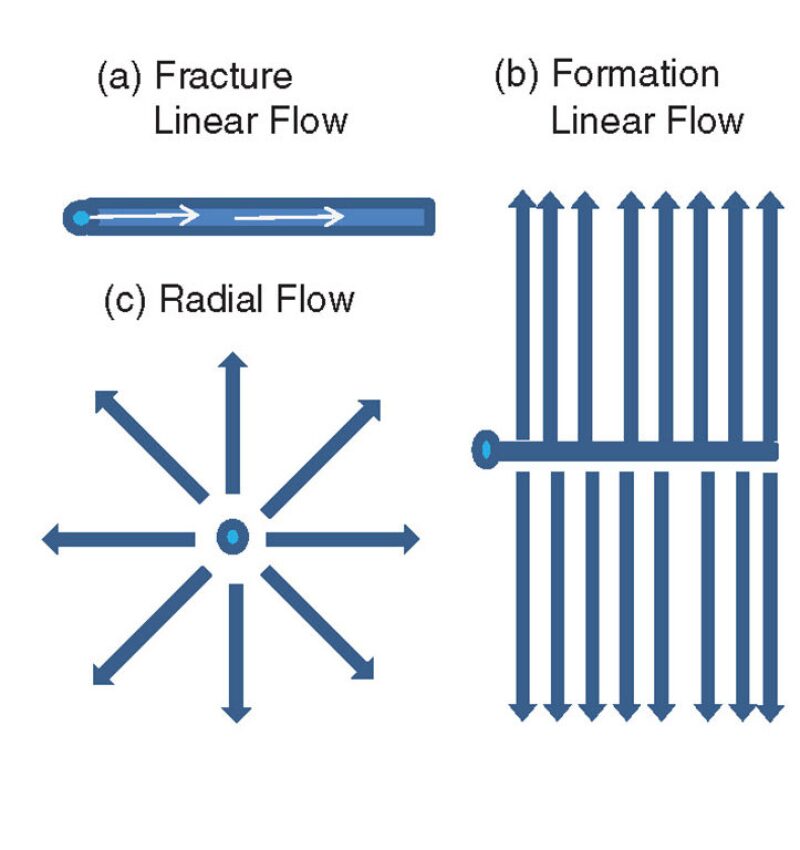
The log-log derivative plot is the preferred flow-regime-identification/diagnostic tool for PTA. It is uniquely capable of identifying all flow regimes, from early time through late time. The current paradigm for PTA is first to identify flow regimes by use of the Bourdet log-log derivative plot and then to use secondary specialized plots to complete the analysis. In contrast, the current practice in minifracture interpretation is to give equal weight to various combination plots (G-function and square root of t) and the Δt (or delta-time) log-log derivative plot. The robustness of the Bourdet log-log derivative plot is one reason that it is one of the outstanding achievements in the field of reservoir engineering over the last 30 years. A brief overview of the more-common before- and after-closure flow regimes appears in Fig. 1 and Fig. 2, respectively.
Log-log derivative plots have truly revolutionized PTA. However, the reader needs to be aware of a number of issues when applying the technique to minifracture analysis. Generally speaking, with most of the commercially available software packages used for minifracture analysis, a default decision about how derivatives’ smoothing will be calculated for the observed pressure leakoff has already been built into the software and the degree of smoothing that is applied. The software user will have some control over how the derivative is calculated (i.e., the amount of smoothing that will take place). Therefore, it is imperative that the analyst understand the ideas behind these algorithms. For a more detailed discussion of consideration of derivatives, please see the complete paper.
Minifracture Tests on Pad 58-L. Talisman Energy is targeting the upper and lower Montney in British Columbia. The Montney formation, for the purposes of this paper, has been divided into four groups: upper upper (UU), lower upper (LU), upper lower (UL), and lower lower (LL).
There are six horizontal wells completed on the 58-L pad. One vertical wellbore has also been drilled for geological and microseismic-monitoring purposes. For the seven wellbores, four minifracture/leakoff tests were conducted. One was conducted on vertical Well D58-L (LL) and one each in horizontal Wells 058-L (UU), F58-L (UU), and E58-L (UL).
Operational Procedure. All four minifracture tests were conducted in cased-and-cemented wellbores within 4 days of each other. The horizontal wells were perforated near the toe of the wellbore over a 1-m interval. The minifracture test was then conducted by injecting fresh water at a final rate of 0.5 m3/min (132 gal/min), with injected volumes ranging from 5.5 to 8.3 m3. The minifracture-falloff-pressure data were collected at surface with electronic surface gauges and converted to bottomhole pressures (BHPs) on the basis of a water specific gravity of 1.0 (freshwater gradient=9.8 kPa/m) to the wells’ respective true vertical depths. The wells were shut in for approximately 3 weeks to observe the leakoff behavior.
Breakdown pressures for the horizontal wells (058-L, F58-L, and E58-L) were exceptionally high (BHP gradients in excess of 34 kPa/m), with end-of-job treating pressures indicating average gradients of 33 kPa/m. On the basis of integrated density logs, the overburden gradient in this area is 25.3 kPa/m. Two of the four well tests are discussed here; for test results of the other two wells, please see the complete paper.
D58-L. This is the only vertical well in our study area and was perforated over an interval of 2612.7 to 2613.7-m measured depth. An apparent pressure-dependent leakoff (PDL) signature is pronounced near a G time of 2.5. This early-time feature of the falloff will be described better with the Bourdet log-log plot.
The Bourdet log-log derivative plot with the accompanying PPD curve shows a late-time Carter leakoff (slope of 1.5) ending at approximately 12 hours and is consistent with the G-function closure pick. The after-closure flow regime is identified as formation linear flow, as indicated by the derivative slope of 0.5 and the PPD slope of –1.5. Unfortunately, scatter in the derivative data masks the confidence of the after-closure analysis. This derivative scatter is common with surface pressure data in the late-time region of PTA, and therefore the use of subsurface pressure recorders placed as low as safely possible in the vertical section of the wellbore is recommended.
The early-time derivative and PPD slopes in the first three log cycles are of special interest because a radial-flow regime is suggested by the zero slope of the derivative and the –1.0 slope on the PPD curve. This apparent radial flow is unique to this vertical well and is an interesting observation, considering that wellbore configuration (horizontal vs. vertical) can play an important role in near-field stimulation complexity. If we choose a pressure at the end of the apparent radial flow, then we calculate a gradient of 24.0 kPa/m. This pressure is close to the vertical stress gradient, either suggesting an incorrect closure interpretation (the overburden gradient from the density logs is high) or indicating multiple fractures oriented in various planes such as horizontal parting of bedding planes.
058-L. During pumping of the toe of this horizontal well, bottomhole breakdown pressure was observed at 84 MPa with an end-of-job injection pressure of 80 MPa, or 34.0 kPa/m (see Fig. 3). The corresponding G-function plot demonstrates the classical “belly-shaped” derivative response observed. Typically, this shape of the G-function has been referred to as an indication of height recession or of transverse storage according to current practices. One motivation of this paper was to study the flow regime of this early-time belly-shaped pressure profile.
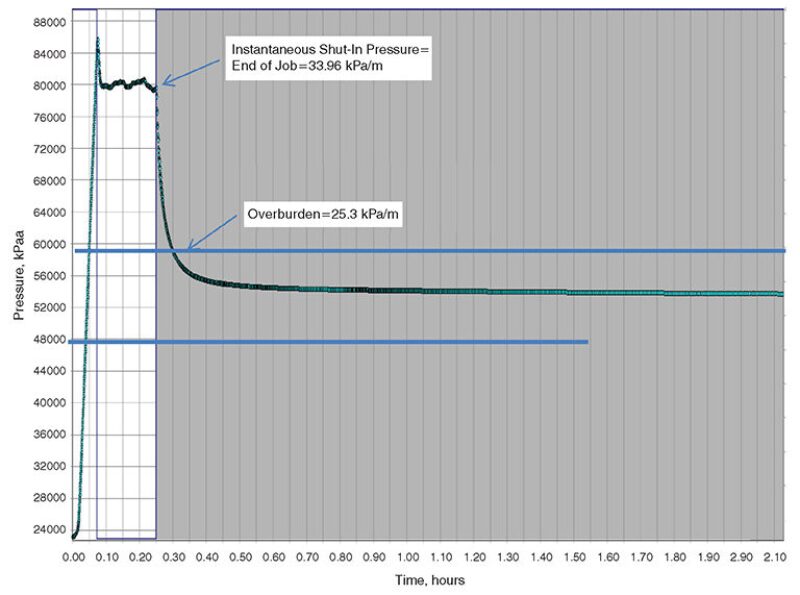
The Bourdet log-log derivative plot with the PPD curve shows some early-time complex flow behavior. The PPD curve drops rapidly and has a slope of less than –1 (an actual slope of –2.0 on the PPD curve). The rapid drop in the PPD continues until approximately 0.4 hours, when the pressure drops below the vertical stress gradient (shown as a gradient of 23.1 kPa/m). This diagnostic behavior is observed in all three horizontal minifracture wells and must reflect the significant near-wellbore tortuosity in these horizontal wells.
The derivative develops into a Carter leakoff slope as identified by the slope of 1.5, indicating a closure gradient of 22.6 kPa/m. Following the 1.5 slope (fracture closure), there is an increase in slope that transitions to an after-closure flow regime of formation linear flow (slope=0.5). The late-time linear flow is also confirmed by the PPD slope of –1.5. Because formation linear flow is the dominant flow regime, a pore pressure is estimated by extrapolation of a specialized linear plot (not shown), resulting in a pore-pressure gradient of 16.1 kPa/m.
The increase in the Bourdet derivative slope after closure is of particular interest. The PPD response at the same time is increasing. In a normal static reservoir situation, the slope of the falloff-pressure time data should be decreasing continuously, never increasing. The increasing Bourdet derivative and increasing PPD are considered a function of reservoir and fracture interaction during prolonged closure. After full closure of the main fracture, the PPD decreases at a slope of –1.5 (linear flow).
Comments
- The closure-pressure gradients with the G-function range from 19.1 to 21.3 kPa/m. On the basis of the Bourdet log-log method, the gradients range from 20.0 to 22.6 kPa/m. These differences might not appear significant, but it should be recognized that, using the G-function only, some analysts would have concluded that there was no closure for two of the tested wells.
- The PPD has been available to the industry since 1992, but has been overlooked in identifying flow regimes. The PPD has no superposition effects built into its calculation, and addresses concerns with erroneous superposition assumptions. The PPD function therefore has practical independent diagnostic capabilities to identify flow regimes in minifracture analysis.
- Although radial flow was not observed with these field examples, when the late-time data were extrapolated to provide an estimate of pore pressure, the pore-pressure gradients were comparable in Wells 058‑L, D58‑L, and F58-L. A slightly higher gradient was determined for the E58-L well. However, this falloff was shorter in duration.
- As shown in vertical Well D58-L, comparisons need to be made between vertical and horizontal wells in the same zone/interval whenever possible.
- It is recommended that BHP measurements be used whenever possible to help with after-closure flow-regime interpretation.
This article, written by JPT Technology Editor Chris Carpenter, contains highlights of paper SPE 163825, “Interpretation of Closure Pressure in the Unconventional Montney Using PTA Techniques,” by Robert V. Hawkes, Pure Energy Services; Irene Anderson, Talisman Energy; R.C. Bachman, Taurus Reservoir Solutions; and A. Settari, SPE, University of Calgary, prepared for the 2013 SPE Hydraulic Fracturing Technology Conference, The Woodlands, Texas, USA, 4–6 February. The paper has not been peer reviewed.