
A common well-completion configuration for shale-gas wells is a horizontal well with multiple transverse hydraulic fractures. This configuration is becoming common for tight gas reservoirs. Pressure-transient testing of this completion configuration has not been considered practical or useful because extracting completion parameters (e.g., fracture conductivity and fracture half-length) from the recorded response requires estimating the effective formation permeability. Estimating permeability directly from a buildup or drawdown test can be performed only if data from the radial-flow period, which reflects this parameter, are recorded. Unfortunately, for this completion configuration in a low-permeability reservoir, this flow period occurs only after extremely long shut-in or flowing times.
Introduction
The usual shale-gas completion is a cased-and-cemented horizontal well, perforated with multiple perforation clusters. Each perforation cluster is treated with an independent fracture stimulation with a large volume of fluid and relatively low proppant concentration. The goal is to create an induced-hydraulic-fracture system, spaced along and covering the length of the horizontal well to provide a large, effective surface flow area in the reservoir. Interpreted microseismic images of these multistage-stimulation treatments indicate that, in some reservoirs, the fractures created at each perforation cluster have dominant transverse components. These dominant transverse components may or may not be interpreted to be overlain with or coupled to a more-complex system of secondary fractures. Even if the secondary system of more-complex fracturing occurs, the relative importance of this secondary fracture system and its relative contribution to the deliverability of the overall induced fracture system remain subjects of debate. It is equally difficult to establish or deny the importance of the overprint of a natural-fracture system to the flow response and performance of multiple-fracture horizontal wells (MFHWs) in unconventional reservoirs.
Therefore, the natural starting point for developing a useful pressure-transient-analysis method for horizontal-shale-well data would be on responses from horizontal wells affected by induced transverse fractures alone. Building viable pressure-transient-data interpretation methods for this simple base-case problem was the goal of this work. This interpretation must be accomplished before considering how to solve the more-general cases that include induced- and natural-fracture complexity. The main issues in analyzing the pressure-transient response from an MFHW are the same as those with a vertically fractured well.
- An estimate of permeability is required to perform a complete analysis of any data set.
- This estimate, in general, can be obtained only from the formation radial-flow regime.
- This flow regime is the last transient-flow regime to occur.
The main barrier to practical analysis in unconventional reservoirs is that this last transient-flow regime occurs at prohibitively long times. With typical fracture half-lengths on the order of hundreds of feet and expected permeabilities in the microdarcy-to-nanodarcy range, the time to the beginning of this final transient-flow regime (the radial-flow regime) is thousands to hundreds of thousands of hours. Because the form of the flow-regime equations dictates that the first issue cannot be avoided and the essential physics of the problem defines the third issue, the formation permeability must be estimated from data obtained before the start of radial flow. The work reported here focuses on a data-analysis method that avoids the general limitation of the second issue.
Type-Curve Development
One possible shape for the pressure-transient response of an MFHW is a log-log diagnostic graph of a drawdown response generated by a numerical simulator with formation permeability of 10 nd and 10 transverse fractures with fracture half-length xf and fracture conductivity set to 800 ft and 3 md-ft, respectively. Development of the type curve is detailed in the complete paper. There are several ways to use these type curves in conjunction with flow-regime equations to analyze pressure-transient data from an MFHW.
An analysis algorithm that uses the type curves developed here requires data in the fracture radial-flow regime. These data are difficult, but not impossible, to measure or capture. For the range of parameters studied in these simulations, this flow regime exists for times on the order of seconds to tens of seconds. Collecting good data this early in time requires careful planning, high-quality gauges capable of high-frequency data collection, and the use of a downhole shut-in device to minimize wellbore-storage effects. Also, post-processing of measured data by use of sandface-rate convolution may be required to remove wellbore-storage effects.
Field Example
To test the viability of these new type curves and the associated data-analysis approach, a field trial was performed in a Woodford-shale-gas well (Arkoma basin). When this well was selected, it had been on production approximately 3 years.
The general plan for collecting data was as follows.
- Shut in the well, pull the existing tubing, return the well to production, and perform a production-log test.
- Reinstall the tubing with a bottomhole-pressure gauge system.
- Return the well to production, and flow the well for approximately 30 days.
- Run a downhole shut-in device approximately 7 days before the planned pressure-buildup test.
- Activate the downhole shut-in device, and collect pressure-buildup data for 14 days.
Fig. 1 shows the data recorded before and during the test sequence. The upper part of the figure shows the pressure data from the downhole gauge, while the lower graph shows the production-rate data used to analyze the pressure data. Bottomhole-pressure measurements started on 7 December 2011 and ended on 10 April 2012.
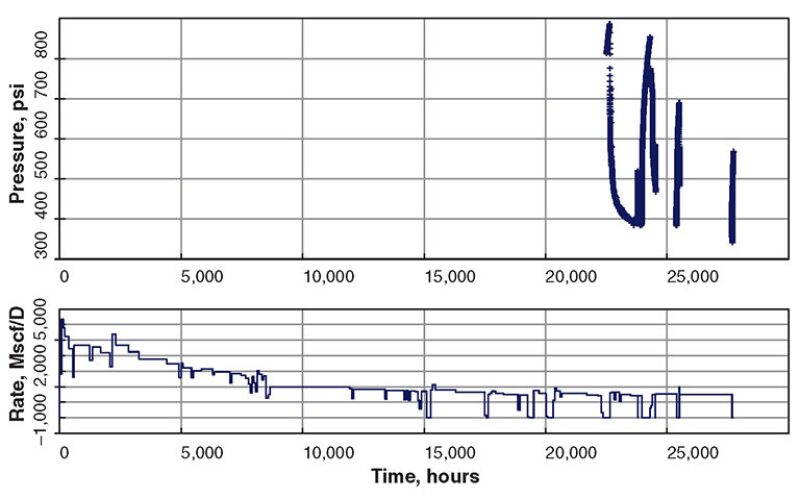
During this test sequence, two main sets of pressure-buildup data were collected. The first set of data was recorded for 331 hours, and the second set was recorded for 95 hours. The second pressure-buildup test was performed to determine the effect of changes to the surface recording equipment on the quality of the measured data. This second test was shortened on the basis of the interpretation of the response captured during the first pressure-buildup period. For both tests, a downhole shut-in device was used during the pressure-buildup periods.
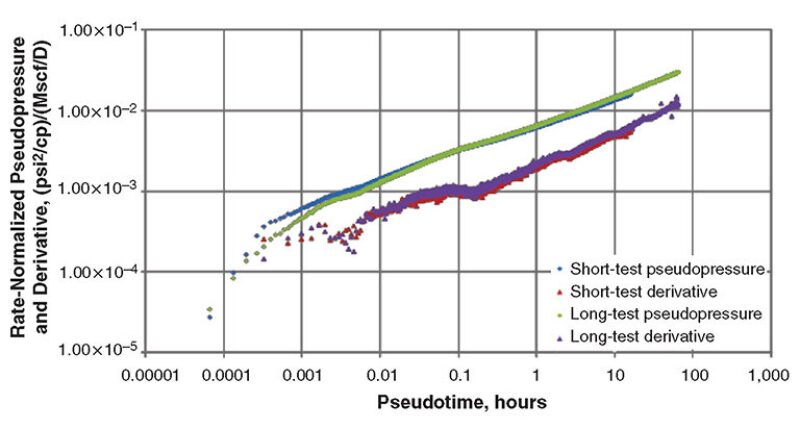
Fig. 2 shows a log-log graph of the appropriately transformed data from the two pressure-buildup tests. Both data sets were smoothed by use of data- and derivative-smoothing algorithms implemented in the analysis software. Data smoothing was necessary to extract the response quality and shape because the raw data contained significant noise. Subsequent retesting of this well with a wireline-deployed, high-resolution, high-recording-frequency gauge confirmed that the response shape in Fig. 2 was valid and representative. Note that the two tests yield essentially the same response shape. Also, the use of pseudotime compressed the apparent test length of the 331-hour test to less than 100 hours of pseudotime and the 95-hour test to approximately 24 hours of pseudotime.
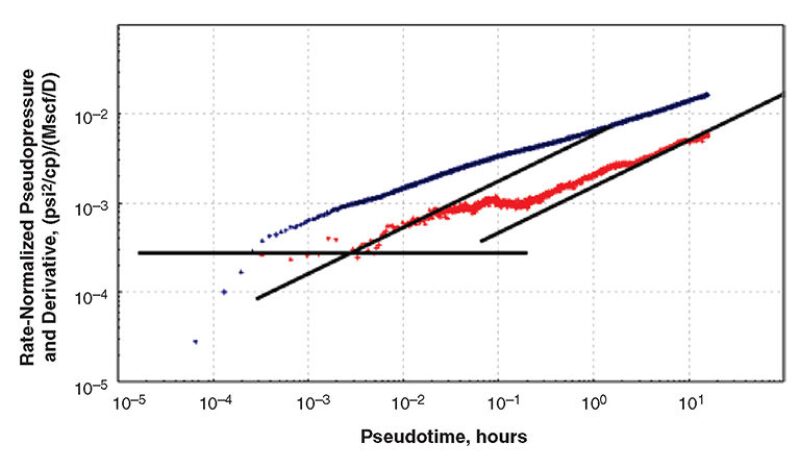
The interpretation of the test response is shown in Fig. 3, a log-log diagnostic graph of the response during the shorter test. Focusing on the derivative, the early data appear to define a constant-slope period thought to represent the fracture radial-flow regime. This period is followed by a half-slope period in the derivative that defines the fracture linear-flow regime. After a flattened transition in the derivative, another half-slope period develops that is broken into three stair-step shifts. These stair-step shifts in the half-slope are being investigated, but may be related to how the data were recorded. However, the last half-slope period represents formation linear flow.
The first step of the analysis algorithm was performed in Fig. 2. Proceeding to the second step, a match of the data in Fig. 2 to the type curve for the dimensionless fracture conductivity FcD=1,000 is shown in Fig. 4. The overlay of both pressure-buildup-test data sets is matched to take advantage of the slightly better definition of the fracture radial-flow regime given by the shorter test and the extra definition of the formation linear-flow regime given by the longer test. The match shown here was obtained by placing the derivative data, defining the fracture radial-flow regime, over the corresponding part of the type curve and then sliding the data graph to the right until the measured data’s derivative matched one of the derivative shapes on the type curve and the late-time spacing between measured pseudo-pressure and derivative honored the spacing between the type-curve pseudo-pressure and derivative. This process was followed for type curves with an FcD=500, 750, 1,000, 1,250, 1,500, and 2,000. The best match obtained is shown in Fig. 4 for FcD=1,000. How-ever, this match is not unique. Matches on the FcD=750 and FcD=1,250 type curves (not shown here) were of comparable quality.
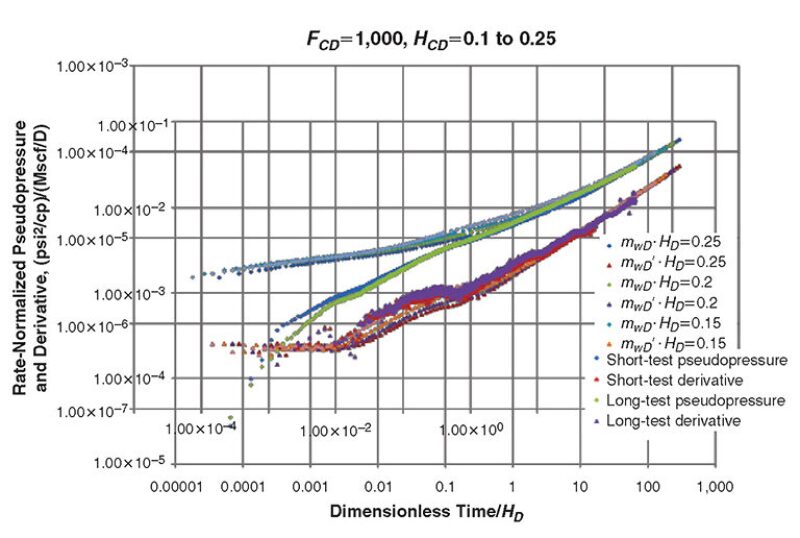
Accepting this match yields an estimate of FcD=1,000. On this type curve, the best match of the fracture linear-flow regime and the subsequent transition period in the derivative was made on the curve parameterized by a dimensionless effective thickness HD=0.1. Formation thickness of the Woodford shale in this well is reported to be 173 ft. Combining this with the matched HD gives an estimate for xf of 1,730 ft. This completes the second step of the analysis algorithm.
Conclusions
- A practical type curve was developed that, when combined with flow-regime equations, allows analysis of pressure-transient responses from an MFHW if the FcD characterizing the well is greater than 500.
- A field trial to test this combined analysis approach was successful. The use of downhole shut-in and high-recording-frequency gauges enabled capturing the very-early-time data critical for applying the combined analysis approach.
- A modification of the original combined type-curve/flow-regime analysis was applied successfully to the pressure-buildup data collected in the Woodford field trial. For this well, the required estimate of the number of near-well fractures was derived by examining the production-log interpretation.
- The measured pressure-transient response of the Woodford is consistent with flow from nanodarcy-permeability matrix into long planar fractures created during stimulation.
- A reasonable interpretation of the data supports relatively few, but long, planar fractures that may be amalgamations of multiple clusters. If effective fracture half-lengths are as great as 1,800 ft, operators will need to reconsider stimulation and well-spacing strategies.
- Despite the ultralow permeability, all pertinent flow regimes were observed in the Woodford well after only 4 days. The resulting analysis can be used to predict long-term performance of the well.
This article, written by Dennis Denney, contains highlights of paper SPE 163983, “An Approach to Practical Pressure-Transient Testing of Multiple-Fracture-Completed Horizontal Wells in Low-Permeability Reservoirs,” by Richard Volz, Elvia Pinto, and Omar Soto, SPE, BP America, and J.R. Jones, SPE, NSI Fracturing, prepared for the 2013 SPE Middle East Unconventional Gas Conference and Exhibition, Muscat, Oman, 28–30 January. The paper has not been peer reviewed.