Foam simulation brings various numerical challenges. Some of these problems are largely cosmetic, creating, for instance, fluctuating fluxes and pressure gradient but no significant effect on final recovery. Others severely influence the whole progress of the flood. This paper discusses the origin of the challenges, how to recognize them, how they can be mitigated, and whether they arise from a correct representation of foam physics or are the unintended result of attempts to solve other numerical problems.
Introduction
Injected gas [carbon dioxide (CO2), hydrocarbon gas, nitrogen, or steam] can be very effective at displacing oil in enhanced-oil-recovery (EOR) processes, but ultimate recovery suffers from poor sweep efficiency. Poor sweep efficiency arises from reservoir heterogeneity, viscous instability, and gravity override of gas. Foam can address all three causes of poor sweep efficiency. Foam is a dispersion of gas separated by water films called lamellae that separate the gas into bubbles; the lamellae are stabilized by surfactant. Thus, foam requires the presence of gas, water, and surfactant.
Two fundamental approaches exist for representing the effect of foam on gas mobility. Population-balance models introduce lamella density (number of lamellae per unit volume of gas phase) as a separate variable and perform a balance on lamellae at each location in the formation, along with material balances on water, gas, surfactant, and oil. Thus, an additional partial-differential equation must be solved at each location and timestep, along with those for saturations of the phases. The model then represents gas mobility as a function of lamella density and other factors.
Local-equilibrium (LE) models assume that the processes of lamella creation and destruction are always and everywhere at local steady state. It is possible to adapt a population-balance model to LE by setting the expressions for lamella creation and destruction equal to each other. Most LE models, however, represent the effect of bubble size implicitly in relations for gas mobility as a function of water and oil saturations, surfactant concentration in the aqueous phase, and other factors.
Foam can be injected in at least four ways:
- In coinjection, gas and aqueous surfactant solution are injected simultaneously from a single well. Foam forms in the surface facilities where the fluids meet, in the tubing, or shortly after the fluids enter the formation.
- In surfactant-alternating-gas (SAG) injection, gas and surfactant solution are injected in separate slugs from a single well. Foam forms in the formation where gas meets previously injected surfactant solution or when surfactant solution meets previously injected gas.
- It is possible to dissolve some surfactants directly into supercritical CO2. Then, there is no need to inject aqueous surfactant solution; injected CO2 with dissolved surfactant forms foam as it meets water in the formation.
- Surfactant solution and gas can be injected simultaneously from different sections of a vertical well (gas injected below the surfactant solution) or from parallel horizontal wells (gas injected from the lower well). As far as we know, this approach has not been tested with foam in the field.
Simulating each of these injection methods involves particular challenges.
Challenges to Foam Simulation
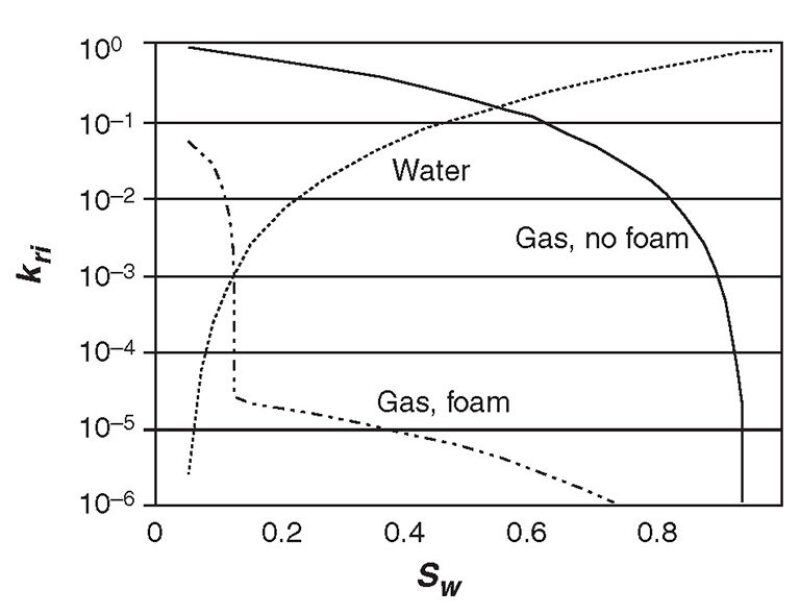
Effect of Water Saturation. Gas, as the nonwetting phase, is at higher pressure than water in the geological formation; this difference is (gas/water) capillary pressure. Capillary pressure draws water out of lamellae; therefore, high capillary pressure is destructive to foam.
Fig. 1 shows the gas relative permeability function with a large reduction in gas mobility.
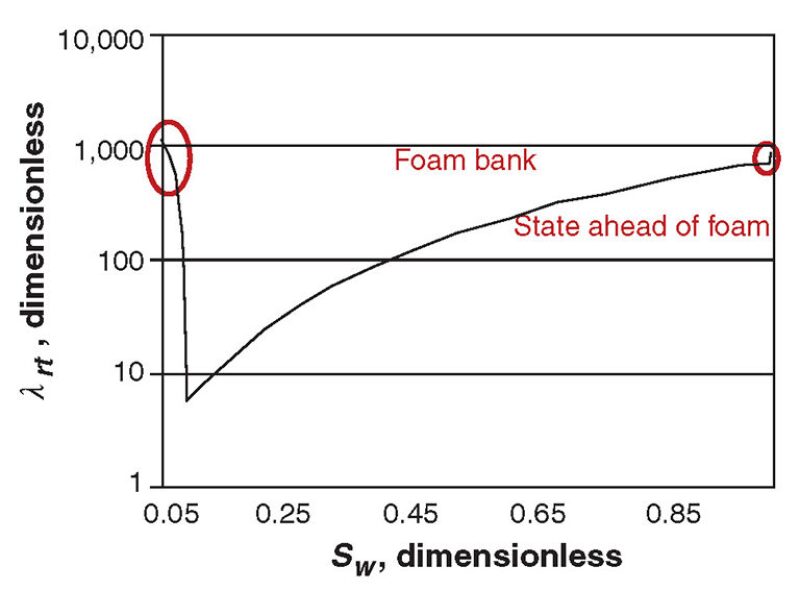
SAG Injection: Fluctuating Injectivity During Gas Injection. Fig. 2 shows total relative mobility λrt with foam (the sum of water and gas mobilities) as a function of water saturation Sw for the model in Fig. 1. During gas injection in an SAG process, there is a shock front at the leading edge of the gas bank from the initial state of the reservoir to a point of very low water fractional flow, where foam has partially collapsed. Thus, the water saturations that would have the greatest mobility reduction with foam are not experienced in the reservoir except within the shock front of negligible width. In a finite-difference simulation, however, each gridblock at the foam front passes through all those saturations and, thus, the mobility reduction at the foam front is overestimated. At least one gridblock at the leading edge of the foam bank has a mobility computed to be below that anywhere in the foam bank itself. As this gridblock passes through the minimum in mobility in Fig. 2, the effect on overall injectivity can be large. In extreme cases, where the foam collapses completely behind this shock, this one gridblock can mask the problem and give diversion of gas flow in the simulation that would not occur in reality.
This problem reflects the finite-difference formulation of the foam displacement, not an inability of the simulator to solve the finite-difference equations.
SAG Injection: Calculating Injectivity. The gridblock with the injection well likewise must pass through the minimum in mobility in Fig. 2. Injectivity is conventionally calculated by assuming a uniform saturation and mobility in the injection-well gridblock and using the Peaceman equation. Therefore, for a time, injectivity in a simulation of an SAG process is extremely poor. In reality, the near-well region crucial to injectivity rapidly dries out and injectivity is much greater than estimated in a finite-difference simulation.
Fine-Scale Capillary Effects. Because foam is sensitive to water saturation and capillary pressure, capillary effects on foam near abrupt transitions in permeability can be significant. Similarly, in flow parallel to an abrupt layer boundary, capillary pressure can draw water from the higher-permeability layer and weaken or destroy foam in a narrow zone near the boundary. In both cases, the affected region is small in width but influences flow over a much larger scale. Accurate modeling of the effects with larger gridblocks remains a challenge.
Effect of Water Saturation: Mitigation. The sensitivity of foam to capillary pressure and water saturation introduces two problems: Individual gridblocks experience mobilities and saturations not present in the displacement except within the shock (Fig. 2); also, abrupt changes in mobility in individual gridblocks introduce oscillations that are unsightly and may challenge the stability of the simulator. Reducing the magnitude of the gas-mobility reduction with foam reduces both problems, if a smaller value is justified by the data.
Similarly, the overall effect of the artificially low computed injectivity decreases as the size of the injection-well gridblock is reduced. Also, the fraction of overall injection-well pressure dissipated in that gridblock decreases (though more slowly) as gridblock size is reduced.
Finally, gas compressibility reduces the effect of fluctuating mobility at the foam front on injection-well pressure, especially as the size of the foam bank increases.
Effect of Surfactant Concentration. The effect of surfactant concentration on gas mobility in foam is nonlinear, with most of the effect coming at low concentrations. In the absence of dispersion (physical and numerical), two surfactant concentrations primarily matter to a foam process: the initial concentration in the reservoir (i.e., zero surfactant concentration) and the injected concentration. In the absence of significant physical dispersion, numerical dispersion rapidly spreads the surfactant front from its initial sharp profile over many gridblocks, though surfactant adsorption (if modeled with a Langmuir isotherm) helps to sharpen the front.
If the true effect of surfactant on foam mobility is combined with numerical dispersion of the surfactant front, the foam bank is extended beyond where it should lie, toward the leading edge of the dispersed front, and the arrival of foam at any location is earlier and more gradual than it should be.
Effect of Surfactant Concentration: Mitigation. As with water saturation, the less abrupt the rise in gas mobility with decreasing surfactant concentration, the smaller the effects. In this case, the artifacts arise from an abrupt change not required to match data but as the unintended consequence of trying to mitigate another problem, the effect of dispersion of surfactant concentration. Refining the simulation grid reduces the magnitude of the effect.
Effect of Oil Saturation and Composition. The effect of oil saturation and composition on foam is complex and not fully understood, and there are many outstanding questions concerning how to represent the effect of oil on foam. The effect of oil on foam is sometimes represented as an abrupt change as a function of oil saturation. This leads potentially to the same sort of complications observed with water saturation, as oil saturation in gridblocks at a foam front pass through oil saturations where foam properties change abruptly. The presence of a third mobile phase introduces an additional, different complication: Composition paths on the phase diagram may attempt to travel along a boundary in which foam properties change abruptly. Maintaining the correct course in such cases is extremely difficult.
Effect of Oil: Phase Names. Simulators define foam as an interaction between aqueous surfactant solution and gas. In a first-contact or multiple-contact miscible displacement, the identity of the nonaqueous phase changes from “oil” to “gas” as the miscible front passes a given location, and there are only two phases present at any location: water and gas or water and oil. Therefore, by definition, there is no effect of oil on foam: If oil is present, there is no “gas” and, therefore, no foam; if gas is present, there is no “oil” to affect the foam. In fact, the effect of oil on foam in such a case is to abruptly create foam (if surfactant is present) when the simulator changes the name of the nonaqueous phase from “oil” to “gas.” If the miscible front is ahead of the surfactant front, then this effect is unimportant; however, in injection of lower-quality foam—or in an SAG flood, where surfactant injection precedes gas injection and the miscible front lags the surfactant front, at least at first—this effect would control the propagation rate of foam.
Effect of Oil: Displacement Front. In an immiscible (or partially miscible) displacement, if oil saturation ahead of the foam bank is great enough to kill foam, foam may still displace oil if oil drains out the gridblock at the leading edge of the displacement front fast enough for foam to build. Whether this would occur in reality depends on the traveling wave at the displacement front, where oil is displaced as foam arrives. Whether this would happen in the simulation depends on how well the simulator, in a single gridblock, represents the traveling wave.
This article, written by Special Publications Editor Adam Wilson, contains highlights of paper SPE 166232, “Numerical Challenges in Foam Simulation: A Review,” by W.R. Rossen, SPE, Delft University of Technology, prepared for the 2013 SPE Annual Technical Conference and Exhibition, New Orleans, 30 September–2 October. The paper has not been peer reviewed.