Gas in tight sand and shale exists in underground reservoirs with microdarcy or even nanodarcy permeability ranges; these reservoirs are characterized by small pore throats and crack-like interconnections between pores. The physics of fluid flow in these rocks, with measured permeability in the nanodarcy range, is poorly understood. Knowing the fluid-flow behavior in the nanoscale channels is of major importance for both simulation studies and calculations of the relative permeability of gas in tight shale-gas systems.
Introduction
Shale-gas reservoirs have pore sizes in the range of 1 to 300 nm. Additionally, the matrix permeabilities of those unconventional gas reservoirs are in the microdarcy to nanodarcy range. When fluid (gas or water) flows in a shale pore, the molecule size is quite comparable to the flow diameter. When some gas molecules strike against the pore wall, they retain a certain velocity that causes them to “slip.” Under those conditions, Darcy’s equation may not be accurate or practical for describing the fluid-flow behavior because there may be other flow mechanisms at work such as slip flow and diffusive flow.
Extensive studies have been conducted on single-phase flow in tight-sand and shale gas systems, and equations have been derived to measure the relative permeability of gas and to determine the single-phase gas-slippage effect. However, under real shale-gas-reservoir conditions, two phases (mostly water and gas) typically exist. It has been reported that in some ultralow-permeability shale-gas reservoirs, water saturation could be much greater than in conventional shale-gas plays. The effects of saturated water on gas permeability/relative permeability and gas slippage still have not been investigated sufficiently.
For laboratory experiments, shale samples were used in most cases in order to represent the real pore structure and distribution in the reservoir. However, there are some limitations of using shale samples in laboratory experiments. For example, water saturation and saturation distribution are difficult to measure. Meanwhile, the laboratory-on-chip technique is becoming a suitable approach for investigating fluid flow in ultrasmall pores. Nano-fluidics and microfluidics have been used in different subject areas for both fundamental research and application. Some micromodels are being used to study multiphase flow under both saturated and unsaturated conditions. Furthermore, the laboratory-on-chip technique provides a means by which to directly visualize fluid-flow behavior, such as the displacement of one fluid by another, because most micro-/nanofluidic chips are made of transparent materials. Micromodels have been used to simulate numerous porous-media-transport phenomena, including microorganism transport in unsaturated porous media. However, visualization studies of fluid flow in nanochannels are still lacking, especially for shale gas and tight gas.
Experimental Methods
Materials and Equipment. High-purity nitrogen gas was used as the gas phase. Ultrapure water prefiltered by a 0.2-µm pore-sized nylon filter served as the liquid phase. Alexa 488 (100 ppm) served as fluorescent dye in the liquid phase.
All images were captured by a reverse microscope and a high-speed-intensified-charged-couple-device camera. The gain and exposure times were set at 80 and 50 milliseconds, respectively. The delay of the shutter driver was set to 10 milliseconds. Data were acquired by use of a software program.
Nanofluidic-Model Representation. Fig. 1 shows a schematic of the entire nanofluidic chip. The nanochannel array consisted of 100 nanochannels with dimensions of 100 nm (depth)x5 µm (width); lengths of 200 µm were built into the chip. Two microchannels with dimensions of 10 µm (depth) ×50 µm (width) ×4–5 mm (length) were connected to the nanochannels for fluid introduction. The micro-channels had equal lengths to balance the pressure drop. T-shaped junctions connected the nanochannels with the microchannels to avoid direct injection, which may have increased the chance of the nanochannel clogging.
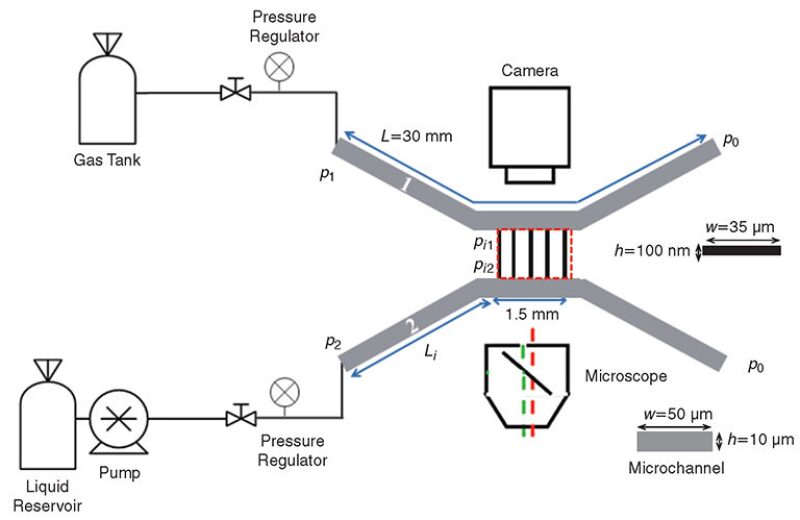
Because the primary objective of this study was to investigate the two-phase flow in nanochannels, the nanochannel array served as the test section; it was considered a porous medium consisting of 100 nanochannels. The test section was 1500 µm wide and 10 µm high; the length of the test section was equal to the length of each nanochannel, which was 200 µm. In the experiments, two microchannels were not considered as part of the test section and were used instead to introduce fluids and to control the pressure drop.
Nanofluidic-Model Fabrication. The nanofluidic chip consisting of micro- and nanochannels with the given dimensions was formed in double-sided polished silicon wafers (thickness=250 µm) with low-stress silicon nitride (approximately 100 nm) on both sides. Next, two micro-channels were defined at either end of the nanochannel array. Finally, the inlet and outlet holes were defined at both ends of the microchannels. First, an array of 100 nanochannels spaced 10 µm edge to edge was defined by a deep reactive ion etch through the back side of the wafer. Each device was removed from the wafer by cleavage along crystal planes. The front side of each device (40×20×0.25 mm) was anodically bonded (330°C, 1 kV, 1 hour) to a thin Pyrex coverslip. In order to maintain the surface conditions of the nano-scale channels, the whole nanochip was rinsed by laboratory reagent water, methanol, and nitrogen gas before use.
Results and Discussion
Gas-Displacing-Water Process and Two-Phase Gas-Slippage Effect in Nanochannels. Experiments studying gas displacing water (flowback) were conducted in the nanochannels. To investigate the two-phase gas-slippage effect, various water saturations were obtained. In Step 1, the test section was pressure filled by water from a microchannel; the water saturation was approximately 94%. In Step 2, the gas phase was injected into the test section through a microchannel under a stable pressure denoted as the starting pressure p1. Water saturation was reduced to a constant ratio (e.g., 29.7%); the gas permeability measurements at this water saturation level were conducted by applying several different pressures pi (pi<p1). Because pi is smaller than p1, water saturation remained constant during the measurement. After a -series of gas-permeability measurements at the same water-saturation level, another set of experiments was repeated from Step 1.
Nitrogen gas was injected under various pressure drops ranging from 10 to 90 psi. The flow rate and flow profiles of gas displacing water were obtained from microscopic images. Immobile water saturation obtained from imaging data was less than 42%. Overall, the water saturation was significantly higher than in results from most shale samples and microscale models, all of which have network pore structures.
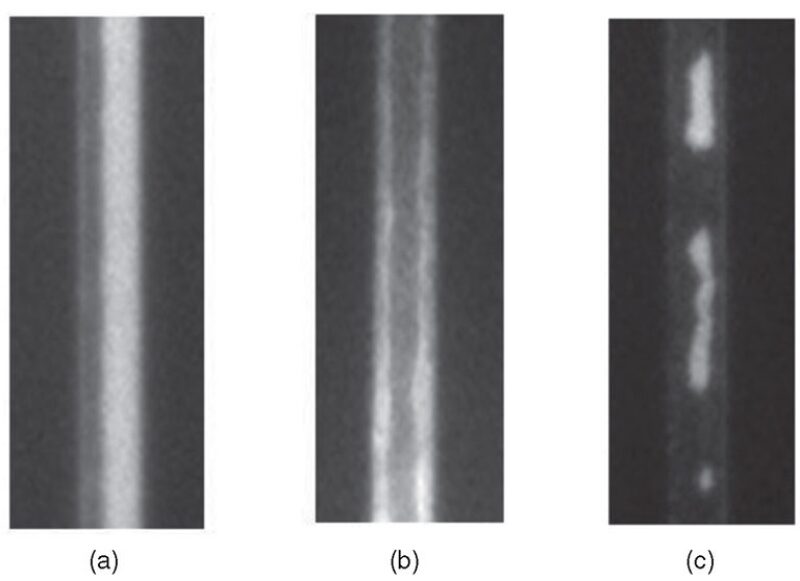
The two-phase-flow patterns of gas displacing water in nanochannels are demonstrated in Fig. 2. Three types of flow patterns were observed. In the first case, gas flow occupied one side of the channel after breakthrough, while the water phase was trapped on the other side of the channel. In the second case, a gas core filled the middle of the nanochannels, surrounded by a water layer on the side walls. In the last case, the gas phase occupied the majority of the channel, and only a few discrete water slugs were attached inside.
To obtain the intrinsic gas relative permeability, the (apparent) gas permeability was determined first without consideration of the gas-slippage effect. The apparent gas permeability correlated linearly with the reciprocal mean pressure under all experimental conditions. There were fewer data points when the water saturation was high (42%) because the saturated water stayed immobile only in the range of low mean pressure.
The intrinsic gas permeability at different water saturations was obtained by linear regression at infinite pressure on each curve of experimental data. It was found that the intrinsic gas permeability was affected by the water saturation. The gas-slippage factor increased with increases in the water saturation.
Some researchers have reported that the gas-slippage factor decreases as water saturation increases. There are many possible reasons for this contradiction, such as the geometry and pore structure of the samples, the method used in establishing the liquid saturations, and the distribution of the water saturation. The amount of remaining water saturation across the test section was also determined by analyzing the imaging data. The water saturation in each separate nanochannel was calculated to determine the distribution across the whole test section. Overall, the saturated water in the nanochannel was randomly distributed across the whole test section, especially for high amounts of water saturation. This random distribution of saturated water may have been caused by the slight nonuniformity of the nanochannel.
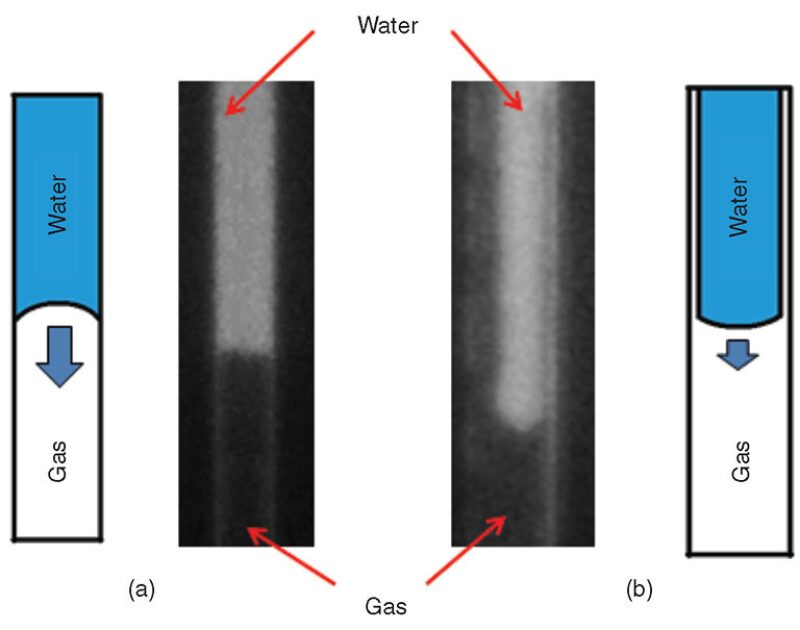
Water-Displacing-Gas Experiments. In these experiments, the nanochannels were 100% saturated with nitrogen gas, and no water was observed in the test section. The water phase with fluorescent dye was pressure injected into the nanochannels. The pressure drop ranged from 0.8 to 57.5 psi. The flow rate, flow pattern, and gas saturation were obtained from the imaging data. Fig. 3 shows the displacement pattern of the water phase displacing gas in the nanochannels before the breakthrough (unstable stage). Frontal displacement (piston-like) was observed in most cases, which was reasonable because each nanochannel consisted of one independent straight channel and uniform cross sections. When the pressure drop was relatively low, a specific displacement pattern, a liquid slug with a cavity on the side, was observed where water did not occupy the entire nanochannel; instead, a liquid core was formed while the gas phase encompassed the edge of the channel. This was probably caused by the geometry of the nanochannels. In the 100-nm-deep channel, the effect of the surface tension on the fluid flow was not negligible. The aspect ratio of the channel was relatively large (width/depth=50), so a liquid-core pattern decreased the surface of the interfaces, thus decreasing the surface energy. Also, the flow profile of water displacing gas and surfactant displacing gas was compared, and no significant flow-profile change was found with the addition of the surfactant. Overall, the residual saturation of gas in nanochannels was very low (<10%) under all experimental conditions, which is attributable to the geometric features of the nanochannels.
This article, written by JPT Technology Editor Chris Carpenter, contains highlights of paper SPE 164549, “Optic Imaging of Two-Phase-Flow Behavior in Nanoscale Fractures,” by Qihua Wu, Baojun Bai, SPE, and Yinfa Ma, Missouri University of Science and Technology; and Joeng Tai Ok, Keith Neeves, and Xiaolong Yin, SPE, Colorado School of Mines, prepared for the 2013 SPE Unconventional Resources Conference, The Woodlands, Texas, USA, 10–12 April. The paper has not been peer reviewed.