The greatest challenge facing the oil and gas industry, particularly in this low-price environment, is to increase recovery rates. Experts in multiple disciplines across the industry are focusing on it because even a small improvement in recovery factors can make a major impact.
To meet this challenge, the industry must do more than look to new, step-change technologies; it must question current practices. For example, the practice of delaying first production after the multistage fracture stimulation of wells is widely seen as a sound operating strategy. Additional shut-ins, whether intentional or unexpected, are a part of everyday well operations. However, a growing body of evidence shows a negative effect on wellbore connectivity with the reservoir.
A recent study examined more than 360 wells in six North American shale plays to determine the effect of production delay and shut-ins (Crafton and Noe 2013). The analyses showed that delaying production quickly damages wells, thus affecting wellbore connectivity and production. A similar result was found for shut-ins, with a strong correlation between the number of shut-ins and incurred damage.
One of the mechanisms causing this damage is the energy stored in the fluid/fluid interfaces in the form of a capillary pressure difference. Historically, the pressure difference has been understood to be relatively small, but in shale plays, it can easily be of the same magnitude as the original reservoir pressure.
The study also examined the potential benefit of using a persistent interfacial tension management (pITM) nanofluid to mitigate these negative effects and found that in cases of production delay or shut-in, wells treated with pITM nanofluid showed improved connectivity and production compared with untreated wells. Therefore, the reduction of interfacial tension has the effect of reducing the amount of energy, or pressure drop, needed to allow flow to begin.
The Study Methodology
To determine the effect of production delay and shut-ins, two metrics were used to compare well performance. The first was the “apparent fracture length,” which describes the degree of connectivity between the wellbore and the reservoir. This value was normalized for proppant weight placed and determined based on flowback pressure and production data, using the reciprocal productivity index approach (Crafton 1997).
The second metric was the first 30 days’ barrels of oil equivalent (BOE) production normalized for reservoir quality (permeability×thickness), wellhead pressure drawdown (choke), and stimulation treatment size (proppant weight).
Impact of Delays
Because of the belief that letting a well rest or soak after stimulation (“shaking and baking”) is necessary or beneficial, it has become a common practice to leave a well shut in before putting it on production, i.e., to delay first production. This is distinguished from putting a well immediately on production following stimulation (post-fracturing blowdown) and then shutting it in.
When first production is delayed, no predelay metric is available for comparison. Previous studies that showed a benefit to delaying production used offset wells for comparison, but failed to account for differing parameters (such as the reservoir, stimulation, lateral length, and shut-ins). This study compared the normalized apparent fracture length (wellbore connectivity) and 30-day BOE metrics with the duration of the delay (Fig. 1a). Both metrics showed that damage occurs very quickly (the time axis is logarithmic) and most severely in the best wells (see the steepness of the upper limit line).
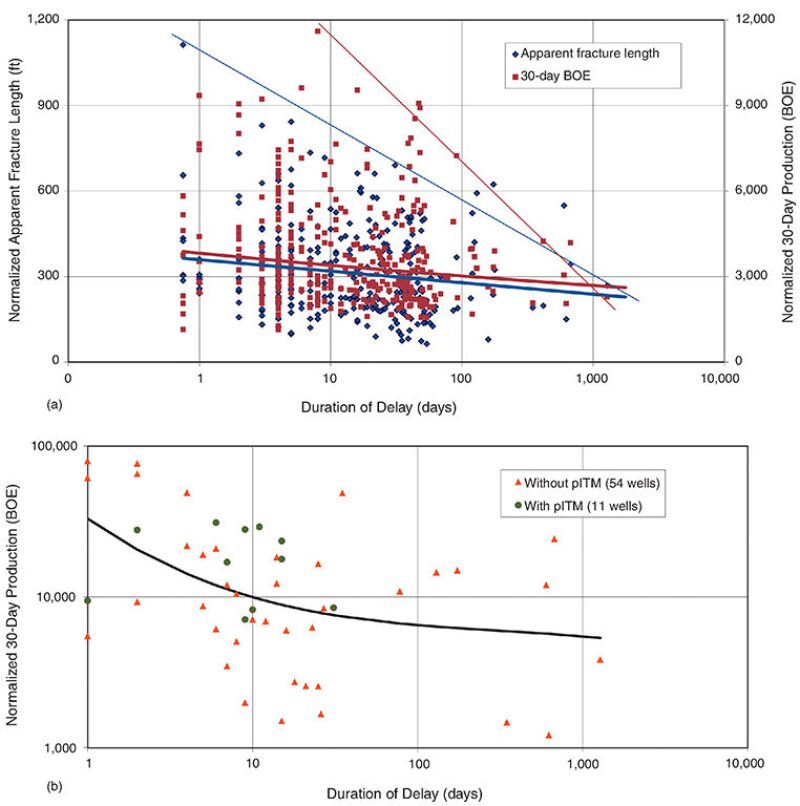
A subset of wells from one basin is plotted in Fig. 1b, which shows the positive impact of pITM nanofluid on the damaging effects of production delay. As would be expected, a plateau is reached at which no further damage is incurred with an extended duration of production delay. The benefit derived from nanofluid use is shown by the relatively higher position of these wells on the graph compared with the untreated wells.
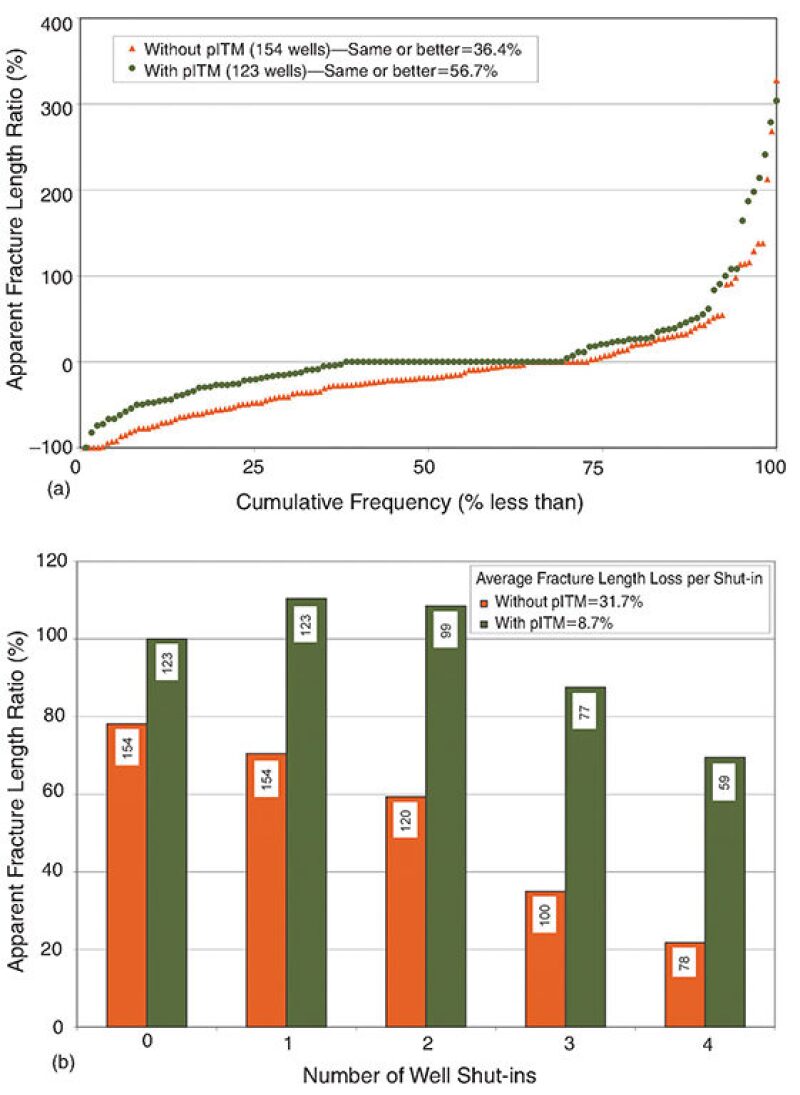
Impact of Shut-ins
Despite the fact that shut-ins are an inevitable part of well operations, very little information is available on the consequences of a well’s subsequent performance. Fig. 2 above shows a cumulative frequency plot for the ratio of apparent fracture length before and after one shut-in. A value of +100% indicates that the apparent fracture length doubled, 0% indicates no change, and -100% indicates that a well behaved as if it had never been stimulated.
Although the graph shows that with or without pITM nanofluid, some wells experience a significant improvement in wellbore connectivity (wells on far right), the majority of the wells fall under the 0% line. Overall, the result of using nanofluid is shown by the 20% increase in wells that performed the same or better with it than without it. Even more telling is the decrease in the number of wells that behaved as if they had never been stimulated (wells on the -100% line on the graph’s far left)—five wells without and one with nanofluid.
Fig. 2b is a summary of the cumulative frequency plots of the average ratio of pre- and post-shut-in apparent fracture lengths for wells experiencing one to four shut-ins. The zero shut-in values signify the average initial apparent fracture length with (green) and without (orange) pITM as a ratio of the wells with pITM (i.e., the average apparent fracture length of wells with nanofluid is set to 100%).
These results show that there is a high probability of pITM nanofluid improving well performance in the first and second shut-ins (average ratios greater than 1). Overall, the average fracture length loss per shut-in was calculated at more than 30% for wells not treated with nanofluid and just less than 9% for treated wells.
Additional analyses showed a slight benefit to extending the time between start of production to first shut-in, but no benefit to decreasing the duration of first shut-in on the damage incurred.
Summary
There are three main conclusions from the study of more than 360 wells in six North American shale plays.
- Delaying production after the end of stimulation is detrimental, which strongly contradicts current practices and beliefs. This damage occurs quickly, affects both wellbore connectivity and production, and is more harmful to better wells.
- Shut-ins are also generally harmful, with damage increasing with the number of shut-ins. The longer a well can be on production before it is shut in, the less severe the damage. However, the duration of the shut-in does not appear to affect the level of damage.
- Damage from the delay of production and shut-ins can be mitigated by the use of a pITM nanofluid.
The study makes clear that the industry not only needs to develop new, step-change technologies such as nanomaterials, but also to question its assumptions about current operational practices if it is to meet the challenge of increasing recovery factors.
The best strategy is to minimize the occurrence and length of production delays and shut-ins, mitigate their negative effects with pITM nanofluids, and manage well operations with an awareness of the damage caused by delays and shut-ins so that they can be avoided.
References
Crafton, J.W. and Noe, S.L. 2013. Factors Affecting Early Well Productivity in Six Shale Plays. Presented at the SPE Annual Technical Conference and Exhibition, New Orleans, 30 September–2 October. SPE 166101-MS.
Crafton, J.W. 1997. Oil and Gas Well Evaluation Using the Reciprocal Productivity Index Method. Presented at the SPE Production Operations Symposium, Oklahoma City, Oklahoma, USA, 9–11 March. SPE 37409-MS.