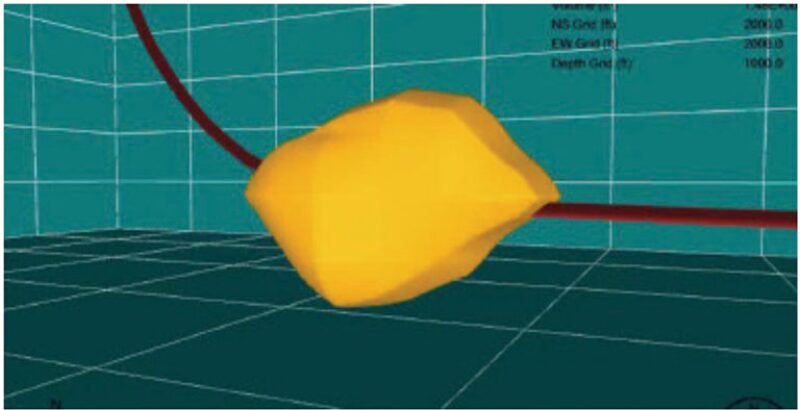
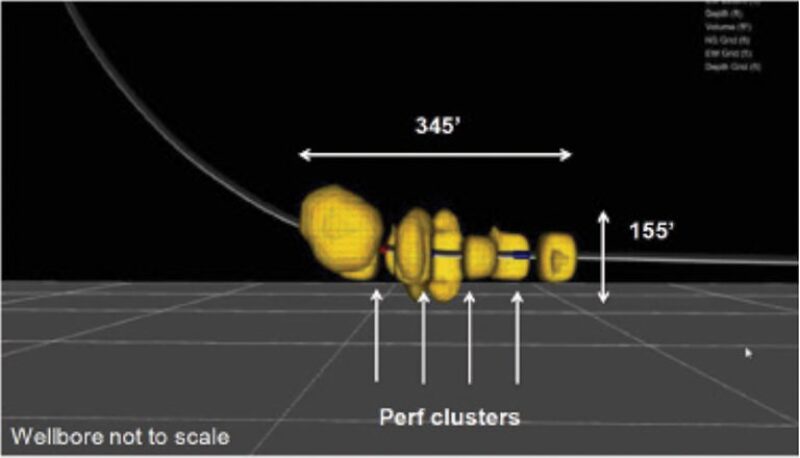
The video shows an image created by Carbo Ceramics using an electromagnetic coating to image proppant placed in two perforation clusters in a west Texas well. After looking around the area, it displays a series of cross sections of the propped area.
Carbo Ceramics is getting a clearer look at where the proppant goes.
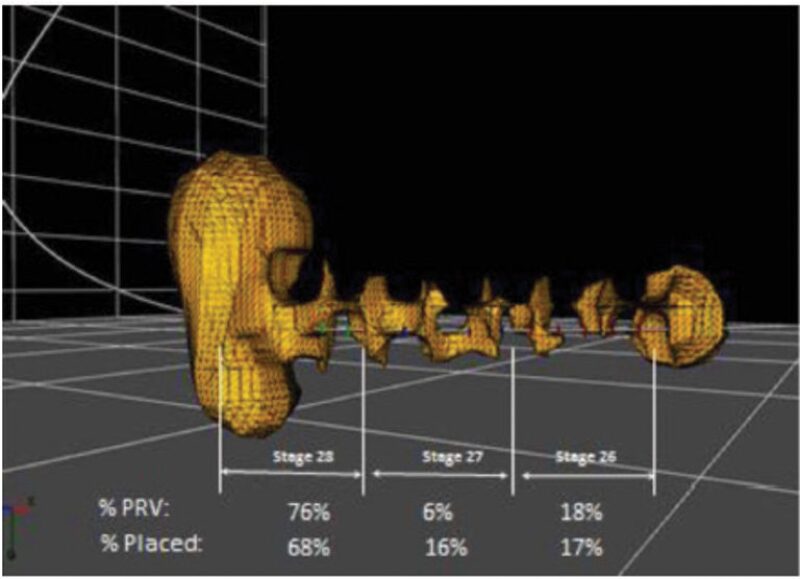
The ceramic proppant maker recently showed much improved images from the ones shown a year ago at the SPE Hydraulic Fracturing Technical Conference and Exhibition (paper SPE 184880) as well as a new set of images showing three stages of a Marcellus gas well.
The presentation at the start of the conference’s technical sessions drew a large crowd. The method the company discussed uses metallically coated ceramic proppant that is activated by an electric current run through a reservoir. It promises a deep look that is not available using alternatives such as radioactive markers, which is visible only within a couple feet of the wellbore.
A reprocessed image of the first test using the proppant highlighted a challenge: processing the faint signals from proppant grains deep in the ground.
“The key is how do you bring these all together and create a proppant image,” said Terry Palisch, global engineering director for Carbo, adding that, “the rest is reasonably off-the-shelf technology.”
Carbo has spent years developing the sophisticated mathematical formulas required to interpret faint changes in electrical and magnetic signals. In the year since Carbo’s paper revealing what it is working on, it has improved the clarity with more data. It has learned to better locate the receivers on the surface to detect the faint electric and magnetic signatures created when it runs a current from the well through the magnetic-coated particles. Getting good data requires identifying noise, which can range from nearby power lines to cows grazing in the area, and finding ways to avoid, or remove it.
Based on what it learned from its first test, Carbo increased the percentage of receivers picking up electric and magnetic signals. While the two sorts of electromagnetic waves offered similar pictures, adding more receivers to pick up more magnetic data may offer more volume and detail, perhaps showing areas with lower concentrations of proppant.
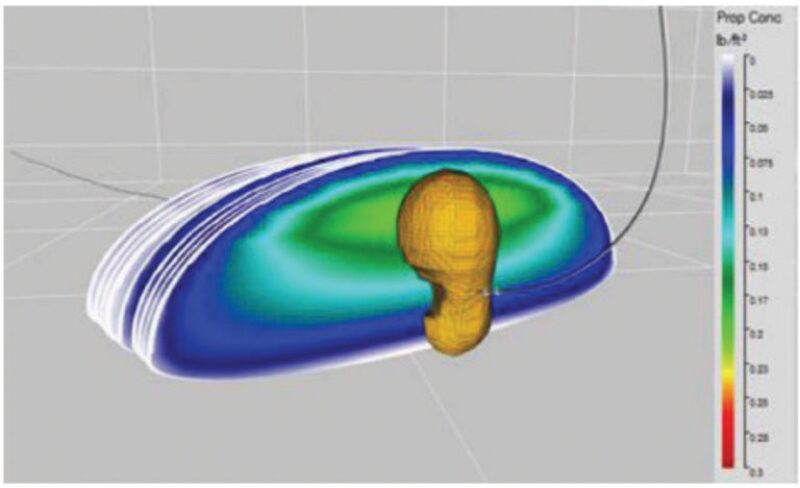
“The model suggests there is a threshold of proppant concentration” imaged, Palisch said, adding, “The propped area is larger.”
The company recently completed the field work for a third test of the system and is now processing that data, he said. It is working to increase the power of the electric current used to stimulate the proppant and use more of the signal and find better ways to reduce noise to create more detailed pictures showing lower proppant concentrations.
Also From the Conference
Saudis Find Proppant Source in Their Own Backyard
Think-Tank Founder and Author Gives Morale Booster to Fracturing Conference Attendees