The Diatomite reservoir in the Belridge field, California, has been under pressure-maintenance water injection to mitigate reservoir compaction and improve oil recovery. Accurate placement of the injection water across this 1,500-ft-thick reservoir is essential to balance voidage and reduce in-situ compaction. However, scale buildup and casing deformation have made monitoring the injection profile by use of conventional radioactive-tracer (RAT) technology a challenge because of the inability to access wellbores for logging. Field tests with fiber-optic (FO) distributed-temperature-sensing (DTS) systems confirmed that the technology had potential to replace the RAT surveys for continuous monitoring of the injection profile. However, moving from a successful pilot to full-field implementation presented many challenges, both technical and economic.
Introduction
Belridge, one of the largest oil fields in California, is approximately 150 miles north of Los Angeles (Fig. 1). There are two major producing horizons: The shallower Tulare sands produce heavy oil (13 to 15°API) by steamdrive, and the deeper Diatomite formation produces light oil (29 to 31°API). In 2012, the Tulare produced an average of 21,000 BOPD and the reservoir produced 41,000 BOPD.
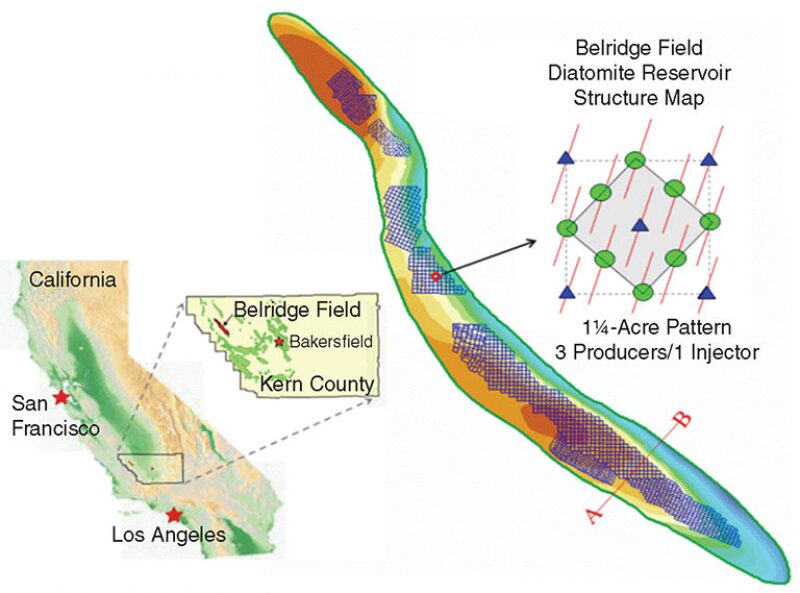
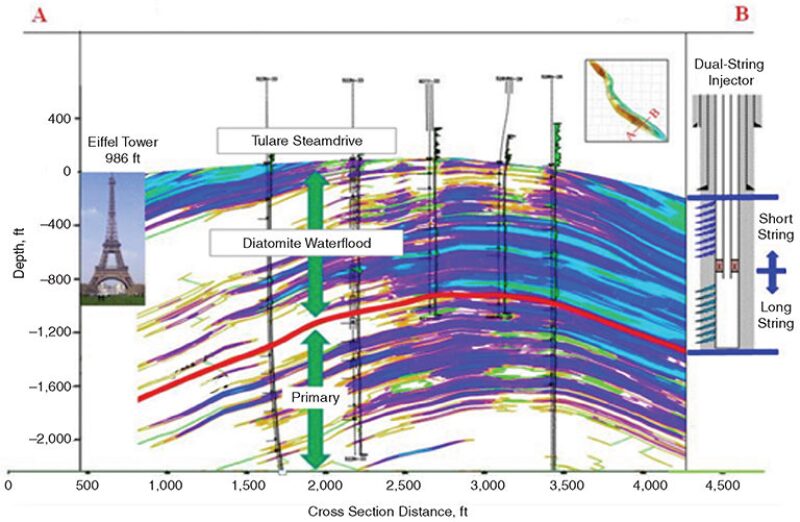
The Diatomite reservoir has very high porosity (50 to 70%), high compressibility (100 to 300×10−6 psi−1), and very low matrix permeability (0.1 to 3.0 md). The upper portion of the Diatomite formation in Belridge has a gross thickness of more than 1,500 ft (Fig. 2), with 21 major depositional cycles grouped into nine conformance units.
Initially, the reservoir was produced on primary recovery by solution-gas drive. Because of the high rock compressibility, pressure-maintenance water injection was started in the late 1980s to combat reservoir compaction. The operator has been investigating methods to evaluate injector effectiveness. One solution was extensive use of openhole wireline formation tests (WFTs) that are run in replacement wells and provide a good indication of vertical-conformance effectiveness. However, WFT pressure profiles indicate only the effectiveness of past injection; they cannot show the current state of injection conformance.
DTS
DTS is a downhole monitoring technology that uses an optical fiber to measure the temperature along the entire length of an optical fiber in the wellbore. The principles of DTS measurement are shown in Fig. 3. A light pulse, typically lasting 5 nanoseconds, is emitted by a laser at the wellhead. As it enters the fiber, the index of refraction (optical density) of the fiber causes the light to slow down. The wavelength of the light pulse in the optical fiber is approximately 1 m. This 1-m packet of light (Fig. 3) is, in effect, a traveling sensor that moves along the fiber and relays back the temperature every meter along the fiber as backscatter. The exact depth of a scattering event is determined by measuring the time required for a single pulse to return to the wellhead from the event horizon.
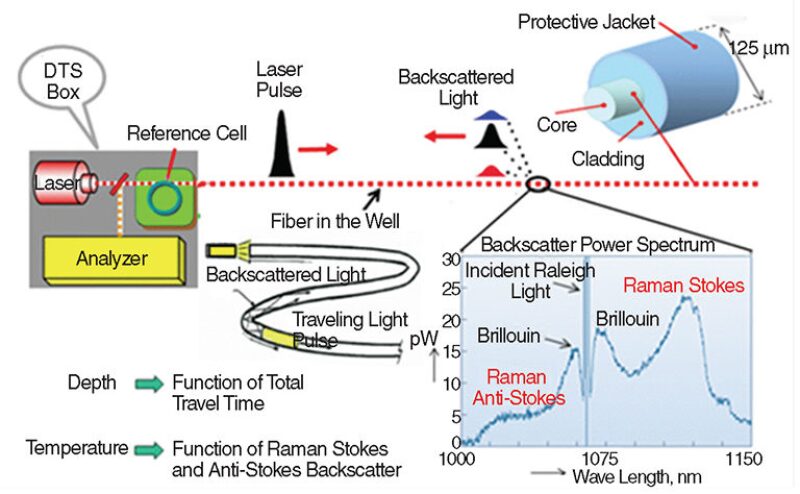
As the laser pulses move along the optical fiber, fragments of the light strike the wall of the fiber and are reflected back to the data-acquisition box at surface. An optical receiver in the box then detects and analyzes the backscattered light spectrum. This spectrum, shown in the inset of Fig. 3, comprises three components: Rayleigh, Brillouin, and Raman bands. The Raman-backscatter band is used to measure temperature. It has two components, Stokes and anti-Stokes; the former is weakly dependent, while the latter is highly sensitive to temperature. The ratio of the energy, or area, within the two bands is a function of the temperature at the depth where the backscatter occurred.
A DTS survey is a set of temperature measurements spaced equally along the length of an optical fiber. When the fiber is placed inside or outside a tubing or casing, a time series of wellbore-temperature profiles can be used to determine fluid movement in the wellbore during water injection or shut-in. Once installed, data can be monitored continuously at the surface to detect changes in downhole well performance (e.g., injection profile) as operation and reservoir conditions change.
Measurement of Injection Profile With DTS
There are three common techniques for measuring and interpreting the injection profile with DTS.
Stabilized Injection. This technique, also called dynamic or steady-state injection, does not require the injector to be shut in. Temperature profiles are recorded with the well injecting at a steady rate. The injection profile for steady-state-injection conditions is derived from a thermal model of the well, which simulates the radial conductive heat loss as a function of wellbore flow rate.
Thermal Restoration. This is the warm-back technique used in analyzing static temperature surveys to interpret production profiles and crossflows in oil and gas wells. It requires the injector to be shut in for a period long enough to detect which zones tend to return to the geothermal gradient.
Thermal Tracer. This method, known as velocity analysis, is a graphical technique that tracks the velocity of a temperature front. This technique is similar to the RAT technique in that both methods estimate fluid velocities inside the wellbore and, by knowing the pipe cross-sectional area, calculate the injection rate. Typically, a hot or cold slug of water is injected at the wellhead or generated (e.g., by a shallow hot zone) in the blank pipe above the injection zone. Then, as normal injection resumes, the DTS fiber can track the hot/cold interface as it moves down the wellbore and exits through the perforations that are taking fluid.
Opportunity for DTS in Belridge
The initial trial, in 2009, that used a temporary FO cable conveyed on slickline proved successful. The results of the interpreted DTS profiles were compared with conventional RAT profiles measured in the same well under similar injection rates and pressures. On the basis of offset WFT pressure data, the DTS-derived profiles appeared to be at least as reliable as the conventional RAT profile.
The two-well pilot was expanded to include permanent-DTS installations in five existing wells across the field. The objective was to evaluate the performance under all types of reservoir and injection conditions: low and high injectivities, varying injection-water temperatures, and areas with or without overlying Tulare steam zones. To reduce uncertainties with survey procedures and interpretation techniques, each well was surveyed and analyzed independently by two service companies.
Successful results of this expanded pilot led to a limited fieldwide program in 2010, retrofitting 25 existing wells by permanently hanging the DTS fiber inside the injector tubing. Although the system worked, the problem with retrofitting existing wells with DTS inside the tubing was loss of wellbore access for future logging or coiled-tubing operations without first pulling the DTS fiber. Also, any time the tubing or packer was replaced, the FO cable had to be rerun, increasing the cost of DTS.
Challenges of Full-Field Implementation
Installing DTS Fiber. Bundled Dual Injectors. The first injectors in Belridge to have DTS deployed outside the casing were bundled dual injectors. These were made up of two 2⅜-in.-casing strings, with the short string servicing the upper-completion intervals of the reservoir and the long string servicing the lower-completion intervals, as shown in Fig. 4. To install the DTS fiber, ¼-in. stainless-steel tubing containing the optical fiber, called the control line, was run through channels in the clamps connecting the long and short strings.
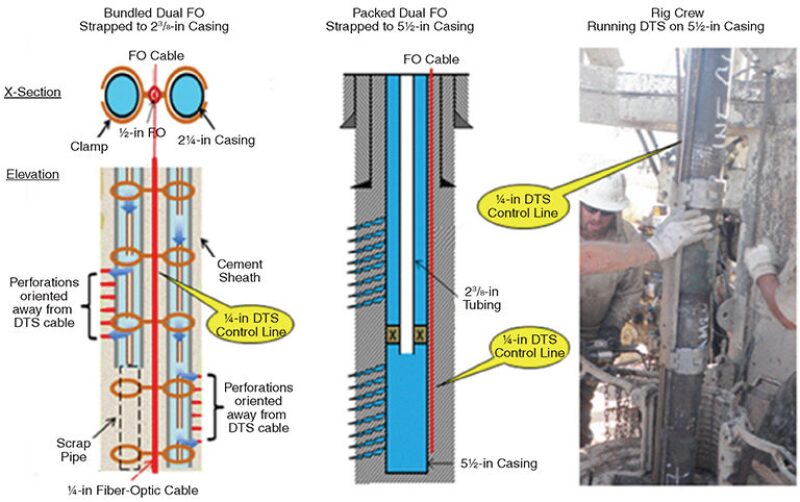
The challenge was to perforate the well for completion without damaging the DTS fiber. When perforating the short string, it was easy to determine the azimuthal location of the fiber by use of a magnetic-orientation tool (MOT) that detected the magnetic signature of the long string, because the control line was sandwiched between the casing strings. However, when perforating the long string, there was no other pipe by which to identify the location of the DTS fiber. This problem was resolved by attaching 2⅜-in. scrap pipe below the end of the short string (Fig. 4). The magnetic signature of this extra pipe helped orient the perforating gun away from the FO cable when perforating the long string.
Packer/Dual Injector. Field studies showed that the smaller 2⅜-in. bundled-dual-injector configuration was not suitable for Belridge because it was more prone to failure than the larger 5½- or 7-in.-outside-diameter casings. Also, the larger casings were easier for workovers. Therefore, the tubingless 2⅜-in. bundled dual injectors were discontinued in favor of a 5½-in. packer/dual-injector design with retrievable tubing (Fig. 4).
The new challenge was to find a cost-effective solution for installing DTS fiber outside the 5½-in. casing, and then be able to cement, perforate, and complete the injector without damaging the fiber. The most difficult task was to make the ¼-in. triple-tube, stainless-steel control line (containing the fiber) visible to the MOT that is run with the directional-perforating gun. Unlike the bundled dual injector, there was no second casing string whose magnetic signature would help locate the control line. After testing various configurations, it was found that with a particular combination, position, and size of braided steel cables, the MOT could detect the location of the DTS fiber.
Integrating With the Drilling Program. After learning how to run the DTS fiber with the casing, cement it in place, and then perforate and complete the well, the next task was to integrate the DTS installation into the operator’s manufacturing-style process of drilling wells. A typical injector requires 2 to 3 days from spud to rig release. For DTS to be acceptable, the installation process had to be quick and simple and fit seamlessly with drilling operations. Several months were required to achieve this goal, but, eventually, the incremental rig time for installing DTS was reduced from 4½ hours to no appreciable difference in rig time between a fiber well and a nonfiber well.
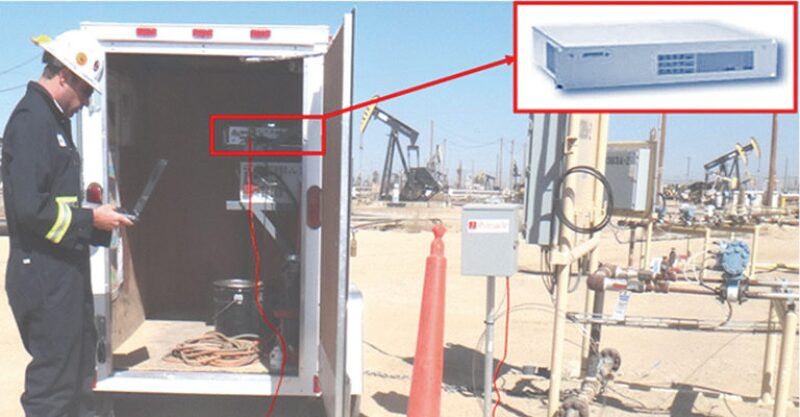
Acquiring DTS Surveys. Factors that need to be evaluated in any data-gathering strategy include the number of wells to be surveyed, survey frequency, proximity of other injection wells, and the physical environment of the DTS lines from the wellhead to the signal-acquisition unit. Many vendors offer units that can connect multiple FO lines to a single unit. However, with continuous drilling and facilities construction in tight quarters, running multiple DTS-FO lines from each wellhead to a central location is not feasible without constant reconnection and the inherent danger of damaging FO lines. It was decided to perform drive-by surveys, mobilizing a single DTS unit (Fig. 5) to a well to obtain an injection-profile survey and then moving the unit to the next well as needed. This mobile data-acquisition solution enabled surveying all wells in the Belridge field with a single DTS unit, significantly reducing capital expenditure while providing sufficient coverage to all wells.
Visualization and Interpretation Software. The operator decided to bring data processing and interpretation in-house in an attempt to reduce costs and improve efficiency. An interim solution was found by making use of existing petrophysical software to visualize and interpret the DTS data. Attempting to integrate wellbore mechanical details and production data stored in several data systems added considerable time between loading data and delivering the final product. With more functionality came more complexity; therefore, an experienced petrophysicist was required to perform the tasks.
Continuous feedback from user to developer and back again ensured building a product that was fit for purpose. It also enabled the software developers to provide innovative ideas to the end user that helped simplify or automate certain processes where this was not originally thought possible.
The final software product took the raw-data file directly from the acquisition unit, pulled in all relevant wellbore details and injection rates, processed the data to improve visual interpretations, and provided the user a simple but powerful tool to interpret the injection profile. After the data had been interpreted, the software had one-click functionality to load the final results into the data warehouse and archive the interpretation for future reference.
Summary
By eliminating reliance on service companies, the cost of data acquisition was reduced by 95%. By developing in-house interpretation capabilities, profile-analysis cost was reduced by 95%. Since the beginning of the field trials, the overall cost reduction has been more than 80%.
As a result, the current cost of acquiring DTS profile surveys is essentially the same as that for conventional RAT surveys. However, the availability of a DTS profile is guaranteed, while the ability to run a future RAT profile is uncertain because of potential wellbore obstructions.
At the time that this paper was written, approximately 70 permanent and semipermanent DTS installations had been run and no fiber had failed because of temperature or hydrogen degradation or because of formation shear. In one instance, the injector failed because of string-to-string communication, but the DTS fiber continues to provide information regarding which layers are flooding effectively and which layers are not. Also, four wells with external FO cable had been hydraulically fractured with a large volume of sand proppant without harm to the fiber.
This article, written by Senior Technology Editor Dennis Denney, contains highlights of paper SPE 163694, “The Challenges of Full-Field Implementation of Fiber-Optic DTS for Monitoring Injection Profiles in Belridge Field, California,” by Mahmood Rahman, SPE, Daniel A. Reed, and Malcolm E. Allan, SPE, Aera Energy, prepared for the 2013 SPE Digital Energy Conference and Exhibition, The Woodlands, Texas, 5–7 March. The paper has not been peer reviewed.