
With the release of Ernst & Young’s (EY) 2017 US oil and gas reserves study, the services firm hosted a presentation in which a panel of its analysts discussed trends among independent, large independent, and integrated companies within the industry. Along with oil and gas reserves, the panel examined trends in capital expenditures (Capex) for exploration and development activities as well as other performance metrics.
A key takeaway from the EY study was that prices are trending lower than in recent history and volatility in price is somewhat subdued. Capex totaled USD 85.7 billion, 27% lower than 2015 and 57% lower than 2014. The study claimed that the oil price has stabilized at a “new normal,” and that this stabilization has helped limit the flow of ratings downgrades and reserve revisions from 2015 to 2016. The US Energy Information Administration (EIA) expects the country to see a 4% growth in oil production in 2017.
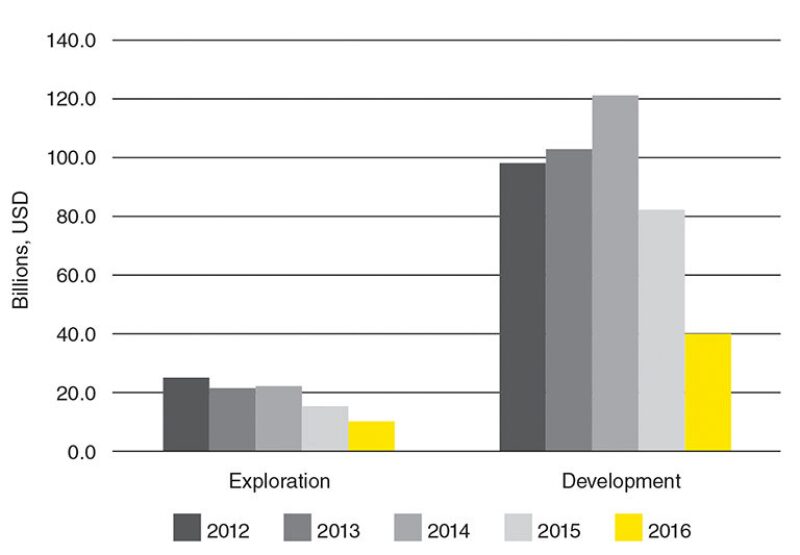
Fig. 1 shows the exploration and development spend in the US by the 50 largest companies based on 2016 US end-of-year oil and gas reserve estimates from 2012 to 2016. James Bowie, senior manager of the financial advisory assurance services group at EY, said there was a significant drop in Capex and the number of net wells drilled: exploratory wells saw a 15% drop, from 1,005 in 2015 to 859 last year, and developmental wells saw a 51% drop from 10,579 in 2015 to 5,194 last year. The study concluded that growth in proved and unproved property acquisition costs was more than offset by significant reductions
Bowie said companies were being more strategic in how they’re developing reserves, placing a greater emphasis on areas where they can see immediate return. In some cases, he said, companies are delaying the development of various assets until they see stronger signs of economic recovery. But despite the drop in activity, he said there was a positive story behind the numbers, namely that capital expenditure dollars are going farther as US producers become more efficient in unconventional drilling and as oilfield service companies see an increase in pressure on prices.
“Even though we’re seeing that decline in Capex for development, that doesn’t necessarily mean that we’re going to see a corresponding decline in production, because each of those developing Capex dollars is going farther than it did last year,” Bowie said.
Herb Listen, EY US oil and gas assurance leader and moderator of the discussion, said that while some Capex reduction is due to an increase in operational efficiency, service companies had still felt significant downward pricing pressure that is not sustainable over the long term. As a result, industry should expect to see further consolidation. Mitch Fane called the merger between Baker Hughes and GE Oil and Gas last month a “transformational” deal in that regard.
“I think a lot of other oilfield service companies were waiting for that [deal] to clear the market, and then they could react from there,” said Fane, southwest region energy leader in transaction advisory services at EY. “We’ve seen an uptick in activity and interest with all the other players in the market trying to figure out how to react and move forward. I would expect that that’s another bit of a renaissance there where some of the stronger players will come out and they’ll be more efficient in the market, which in turn should help a lot of upstream clients that we work with moving forward from a pricing and efficiency standpoint.”
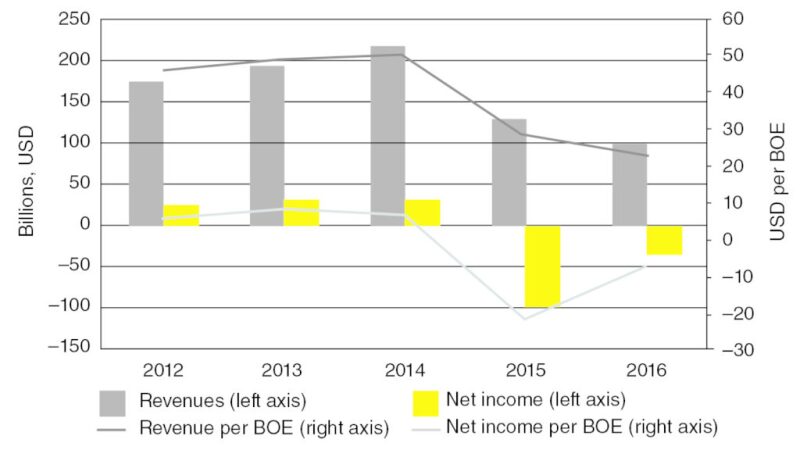
Fig. 2 shows revenue and income from exploration and production activities from 2012 to 2016. The totals are shown on two bases: the lines represent an absolute number while the bars represent a per barrel basis, which Bowie said helps analysts see trends in terms of an overall price decline.
The decline in oil price drove the drop in revenue from 2014 to 2015. Bowie said the drop noted in Fig. 2 was a “double whammy,” in that these drops led to a drop in price expectations, which led to reserve revisions and subsequent impairment of assets. In 2016, EY saw a significant reduction in the number of impairments, which caused revenue and income to revert to the mean. Bowie said that, while not ideal, this reversion is a positive sign.
“Unfortunately, it is still a net loss, so that is why we talk about this being less bad but still not good,” Bowie said. “But we’re starting to head back in the right direction.”
Oil reserves showed a modest decline of 2% in 2016 as extensions and discoveries helped offset a 3% drop in production, while substantially lower downward revisions were recorded compared to 2015. Oil reserves were 24.4 billion bbl in 2015 compared to 23.9 billion bbl in 2016. End-of-year gas reserves dropped by 1% in 2016 to 149 Tcf, compared to a 21% drop in 2015 that was largely due to significant downward reserve revisions.