An article published in the April 2014 JPT (McMillan 2014) discussed an SPE workshop survey regarding confidence in the SPE Petroleum Resources Management System [SPE-PRMS (2007)]. This survey identified issues regarding the believability of publicly disclosed reserves and resources. The survey also concluded that the interpretation of the SPE-PRMS in relation to unconventional resources is not consistent among reserve estimators. Critical to the integrity of our industry is confidence in publicly disclosed reserves. These reserves often come with limited supporting data and, therefore, tools need to be developed to enable the users, who may have limited technical knowledge, to identify estimates that should be used with caution or require additional supporting information.
McMillan (2017) proposed a modified version of the reserves-production ratio, called the Reserve Confidence Metric (RCM), to gauge confidence. Poor confidence does not mean the reserve estimates are wrong; it means that the estimates are to be used with caution or further information is required.
The SPE-PRMS presents a resource classification framework where reserves are the discovered recoverable volumes (contingent resources) for which the entity claiming commerciality has demonstrated a firm intention to proceed. The reserves are further characterized by the “range of uncertainty” generating a low, best, and high estimate referred to as proven reserves (1P), proved plus probable reserves (2P), and proved plus probable plus possible reserves (3P). 1P is often referred to as the banker’s case; 2P as the investor’s case; and 3P as the investor’s upside potential.
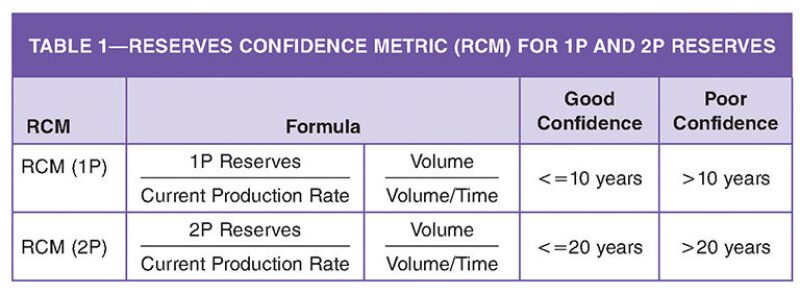
Because reserves estimates are influenced by economic factors, the timing of a project’s production is integral to its valuation. McMillan (2017) demonstrated that reserves post-20-years had negligible impact on a project’s economics. RCM, which is derived from the reserves-production ratio (RPR) and reserves life index (RLI), ranks 2P reserves estimates as good confidence if the ratio is less than or equal to 20 years. Otherwise it is ranked as poor confidence. In the case of the RCM ranking of 1P reserves, 10 years is proposed as the pivot point. The RCM ranking is summarized in Table 1.
RCM often registers poor confidence when the producing field is in the commissioning phase. In the case of undeveloped reserves, RCM will always be ranked as poor confidence. Having a rank of poor confidence requires the user to either use this information with caution or seek further clarification.
RCM can be applied at any reserve level: country, lease, field, well, and reservoir. The following are examples of applying RCM[2P] to production areas located in Queensland, Australia. All the reserves and production data presented are available from the Queensland State Government website (Department of Natural Resources and Mines, Queensland Government 2016).
Fig. 1 plots RCM[2P] of the GM coal seam within the reservoir in production lease (PL) 191 over a 10-year period.
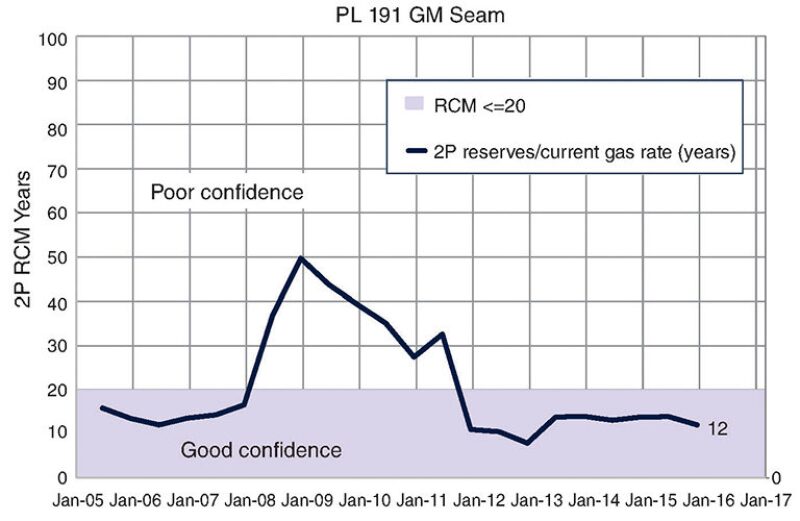
This curve is very simple to generate, requiring no geological or engineering knowledge to identify the confidence level of the disclosed 2P reserves. In this example, from June 2008, RCM[2P] changed from good to poor confidence. At this moment in time, any stakeholder utilizing these reserves estimates must use the estimates with caution or gather additional information, that is, ask questions. Fig. 2 shows the change in RCM status was due to an increase in 2P reserves and drilling activity. The corresponding gas production through to June 2010 indicated the results of the drilling campaign may not have justified the previous reserve increase and subsequently the reserves were progressively written down.
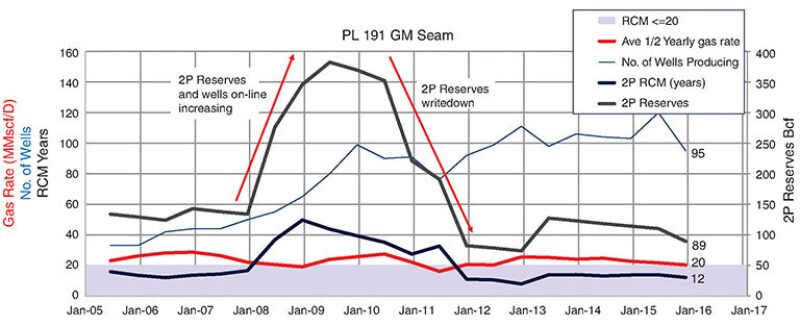
Plotting RCM over time can generate insight and confidence in how the operator manages reserves. Since January 2012, the RCM has a rank of good confidence.
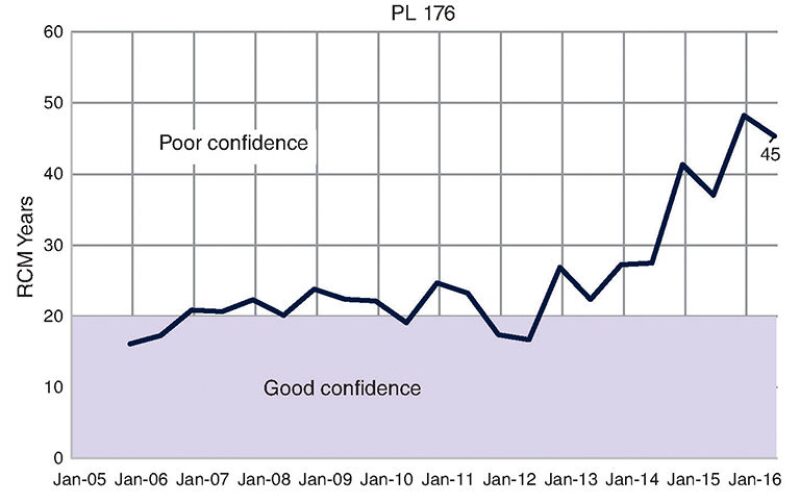
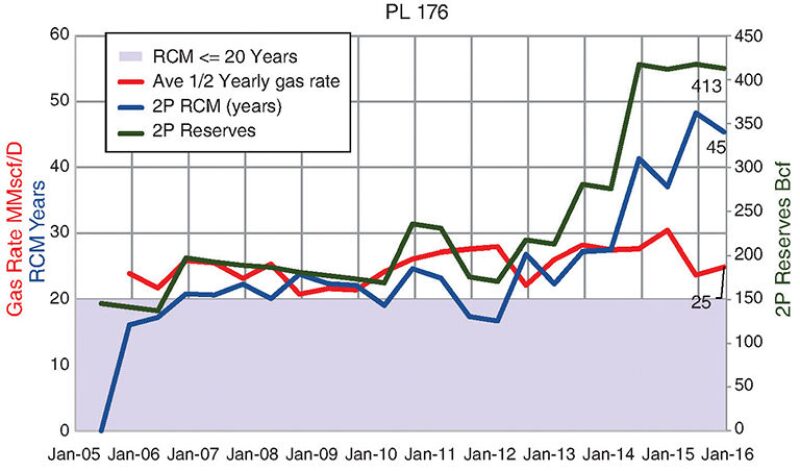
Fig. 3a shows a producing asset’s (PL176) RCM over a 10-year period. A constant RCM[2P] is seen to June 2013 and then it gradually increases. Based on RCM[2P], the current ranking is poor confidence and therefore the user of this reserves information should proceed with caution or gather more information. An increase in RCM requires either the reserves to increase, or the production to decrease. Fig. 3b shows that production has remained constant, whereas reserves have increased. This explains the change in RCM but not the reason for the change in reserves. This would require an explanation from the reserves issuer or estimator. Asking questions will improve confidence and integrity.
RCM can be used to evaluate reserve databases to identify areas where data should be used with caution or require additional information to improve confidence. The following example utilizes the publicly disclosed 2P conventional and unconventional reserves and production data from the Australian state of Queensland, which is published every 6 months. These reports are available from the Queensland Government’s website [Natural Resources and Mines, Queensland Government (Dec 2016)].
In Queensland, there are 209 (137 unconventional and 72 conventional) 2P reserves and 6-month production reports. Table 2 shows the RCM[2P] for Queensland total gas resources as of 30 June 2016.
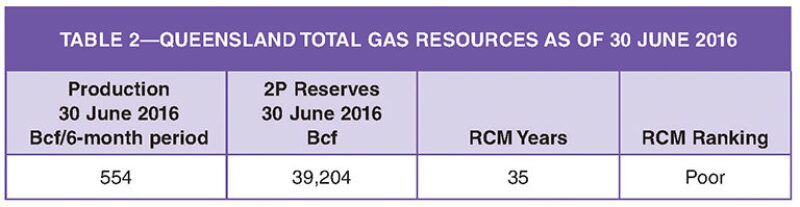
The RCM ranking of the total 2P reserves is classified as poor confidence, signalling a need to perform further analysis. Table 3 breaks down the total resources into conventional and unconventional (coalbed methane [CBM]) resources.
The conventional 2P reserves RCM score is below 20 years and, depending on the importance of this reserves information, the stakeholder may have reasonable confidence to proceed with its endeavors. In the case of unconventional resources, further investigation is required.
RCM of the unconventional resources indicates the data need to be further refined. There are 137 reserve reports covering exploration licenses (Authority to Prospect [ATP] and Production Leases).
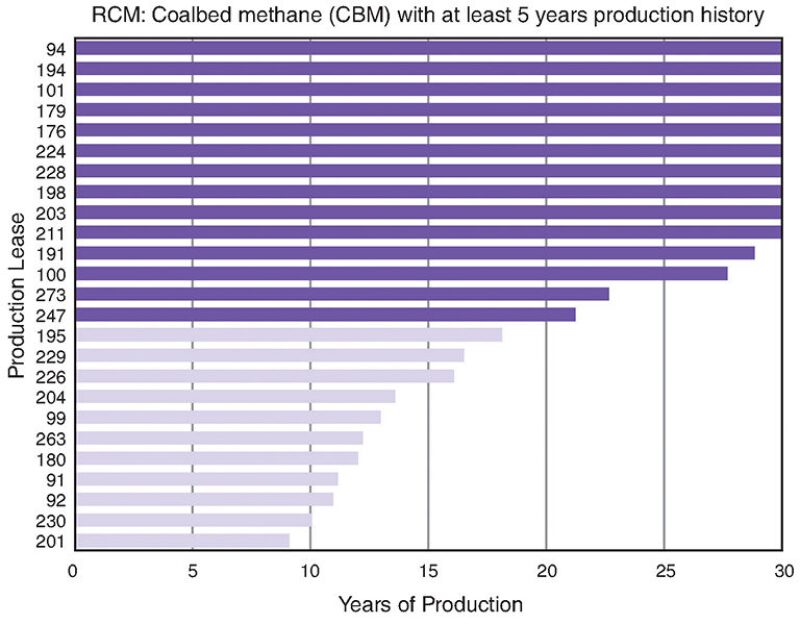
CBM fields often take time to de-water before reaching peak production and for this example, the RCM[2P] of CBM assets which have been in production for greater than 5 years are plotted in Fig. 4 above.
Fifty-six percent of CBM production leases have an RCM[2P] ranking of poor confidence. This does not mean their reserves are wrong. RCM only flags that further information is required to improve confidence in the estimate. Explanations for the rank of poor confidence include items such as production is restrained, has not reached peak production, undeveloped reserves’ component, overstatement of reserves, poor production performance, etc.
Reserves such as publicly disclosed reserves often come with limited supporting evidence. RCM is a simple tool to identify reserves estimates that should be assessed with caution or require further information. The SPE-PRMS guidelines will evolve and improve with time, but will always be subject to interpretation. Improving confidence in the SPE-PRMS will require reserves estimators to have the tools to identify anomalies and to know when to ask for additional information. RCM is such a tool.
References
Department of Natural Resources and Mines, Queensland Government. 2015. Petroleum and Gas Production and Reserve Statistics.
McMillan, D. 2014. Techbits: Workshop and Survey Focus on SPE Petroleum Resources Management System. Journal of Petroleum Technology 66(4): 38.
McMillan, D. 2017. Gauging the Confidence in Publicly Reported Oil and Gas Reserves: Introducing the Reserves Confidence Metric (RCM). APPEA Journal 57(1): 88-99.
SPE-PRMS. 2007. Society of Petroleum Engineers Petroleum Resources Management System. Prepared by the Oil and Gas Committee of the Society of Petroleum Engineers, reviewed and jointly sponsored by World Petroleum Council, American Association of Petroleum Geologists, and Society of Petroleum Evaluation Engineers.