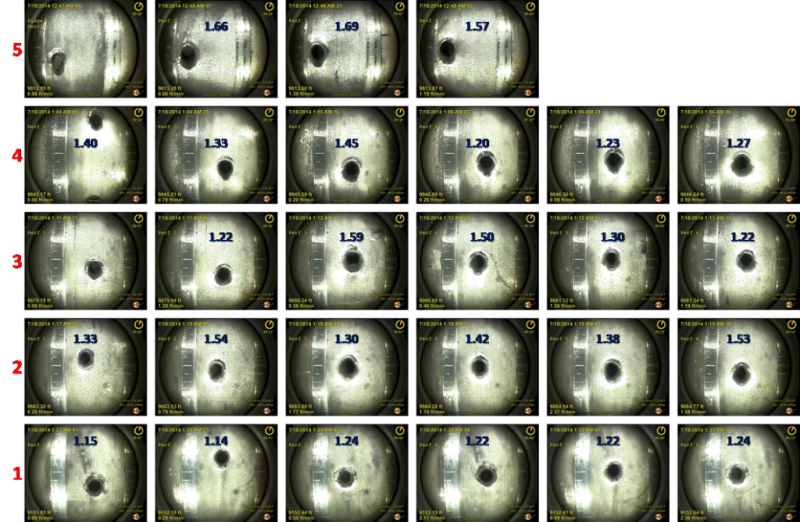
Fracturing leaves its mark on each of the perforations penetrating the steel casing.
The array of perforations above (Fig. 1) were eroded by water and sand surging through these entry holes, some more than others.
Dave Cramer, senior engineering fellow for ConocoPhillips, said pictures shot after fracturing are full of telling details when combined with other diagnostics. These shots were created by EV, an in-well imaging and analysis company, for ConocoPhillips. They were featured in a technical paper (SPE 194334) delivered by Cramer at the recent SPE Hydraulic Fracturing Technology Conference.
The multiple shots are displayed based on their location within a stage. Those shown at the top belong to the cluster reached first by the fracturing fluid (heel side), which is likely to take in the most fluid, and that is confirmed by the degree of erosion. The numbering system for clusters assigns 1 to the cluster nearest the toe end of the well, and 5 to the one nearest the heel.
Limited-entry designs ensures that all of the perforations are stimulated, but the search for even treatment and better control continues.
Eroded to an Oval
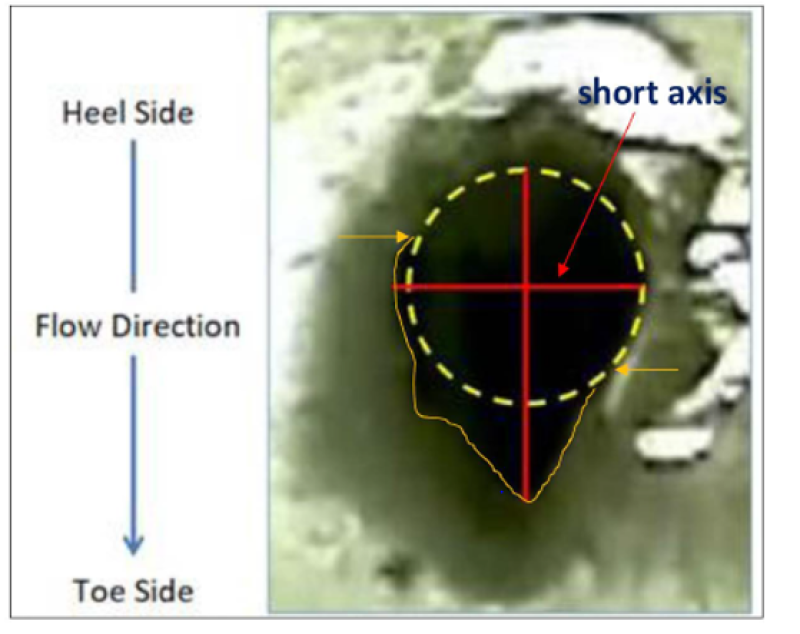
Circular perforations are carved into ovals during fracturing. The circular hole in the casing was elongated in the direction of the flow (Fig. 2). The imaging software from EV measures the degree of ovality—the longest diameter compared with the shortest one. Greater surface erosion also shows greater expansion of the flow capacity in the hole.
“Due to momentum, the more massive proppant grains tend to move slightly past the entry hole centerline but end up getting pulled through the entry hole along with the carrying fluid (water) due to the vortex that is created by the highly turbulent jet of fluid/slurry moving through the entry hole,” Cramer said. “The distal side (toe side) of the entry hole tends to take the brunt of the proppant interactions as proppant moves into the entry hole, due to the momentum effect.”
While the momentum shapes the hole, he does not agree with those who say that significant amounts of sand are unable to make the turn and exceed what can be pumped into later clusters at the end of a stage.
“Under typical conditions for ConocoPhillips’ limited-entry treatments, it appears that very little of the proppant separates from the carrying fluid,” Cramer said.
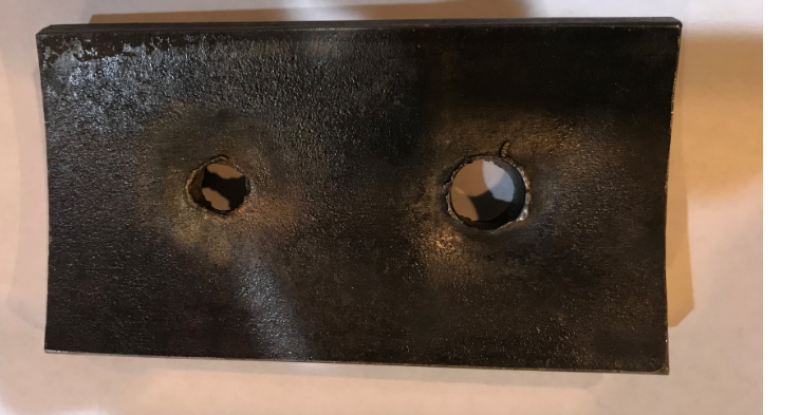
Big and Small, Up and Down
This picture from EV shows the extreme differences possible in a well (Fig. 3). Cramer was not familiar with the completion, which was not from a ConocoPhillips well, but he said the images showed remnants of the original circumference in the more eroded perforation, which could explain the difference in size. “This is evidence that the more eroded perforation of the pair had a larger initial entry hole,” he said.
Bigger holes take in more fluid, resulting in greater erosion around the perforation. When that happens it greatly expands the flow and the potential fracture growth. The visual analysis can show it has expanded all the way to the backside of the hole.
A secondary factor was the perforation locations. The bigger hole was on the bottom of the casing, allowing gravity to increase the proppant flowing though it compared with the perforation at the top of the casing.
Gradually Expanding Clusters
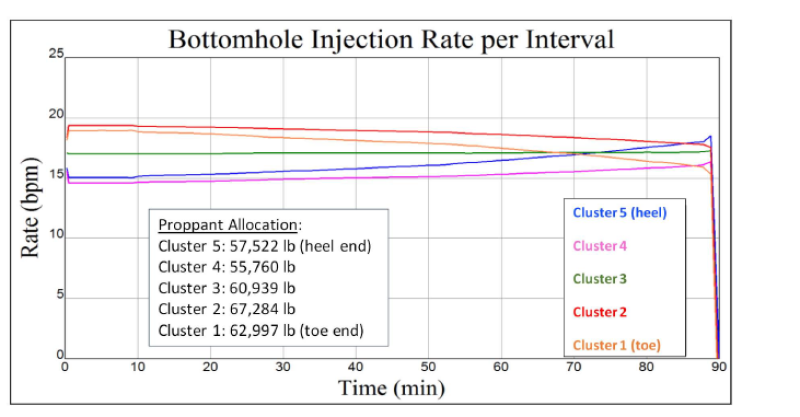
One approach to limiting entry is to reduce the number of perforations in the heel-side clusters, which otherwise would take in the most fluid, forcing more fluid to flow to later, larger clusters.
Testing has shown the decrease has to be relatively gradual (Fig 4). In this case there are five perforations in the first two clusters, six in the next, and seven in the last two (toe side).
An abrupt shift from four to six, increasing the flow area 50%, is too drastic a change. Such a large difference is likely to leave the heel-side cluster under-stimulated. The 20% change from five to six is “sufficiently subtle to avoid over-correction,” Cramer said.
Nothing Like a Bullet
Limiting differences in perforation growth begins with shooting even-sized entry holes. Cramer looks back fondly on the holes shot by bullets, which created a cleaner, more even hole than the shaped charge on the left. This matters because the shape and texture of the hole affects the flow of slurry through it.
The picture above is a rare, old test shot in a section of casing that shows how the two systems create differing entry holes (Fig. 5). Cramer described it as “a valid and honest representation that few, if any, perforating experts or service providers would challenge.”
The size difference was due to a difference in the specifications, not the method used to create the hole.
Cramer recognizes that bullets are not coming back. The business is now built around shaped charges, with designs capable of meeting modern challenges, especially heavy pipe made of high-grade steel, he said. Service companies are no longer providing that sort of support for bullets.
But he said the picture sets a “standard for currently available technologies striving to achieve the elusive equivalent entry-hole diameter.
Different in the Well
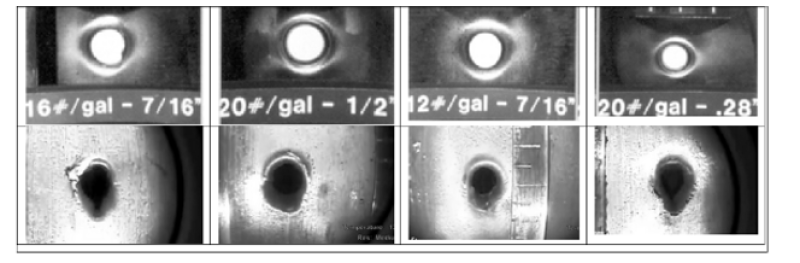
Erosion tests on the surface do not match the changes in entry holes observed in the well. The upper row of pictures shows surface tests, while those below were shot in a well after it was fractured (Fig. 6). The difference is due to the high cost of replicating downhole conditions during fracturing that dictate how sand moves through entry holes during fracturing, Cramer said.
It is “more economical to perform in-situ measurements following the treatments,” he added.