
The upstream industry’s pervasive struggle to account for and make use of its data has become almost cliché. But it is a reality—even though the industry is now multiple years into its digitalization phase.
Among the many entrepreneurs and researchers coming up with solutions, two entities have leveraged data donations from big operators in an effort to make data access as quick and easy as a Google search.
A big operator, which may have interests in basins all over the world, adds terabytes upon terabytes of data from its wells each day to the generations of data it has already accumulated over decades. These large, disparate sets of information come both structured and unstructured from a variety of sources. Interpretations of those records can vary depending on the terminology used by the faceless person or program that put them together.
Externally, a large portion of operator data is still stowed in a disorganized manner on servers owned by multiple electronic drilling recorder providers, observed Pradeep Ashok, senior research scientist in the drilling and rig automation group at the University of Texas’s Hildebrand Department of Petroleum and Geosystems Engineering, one of the entities tackling this problem.
Operators can download the data, view the data through a web interface, and perform analysis locally. But the more ideal option would be to have all the data readily accessible in a data store within the company.
Internally, in many cases, data sit in different silos within a company, spread across different physical locations. And the people who work with that data are not static entities: When the downturn hit a few years ago and layoffs occurred, gobs of data were left stranded. Operators are still trying to account for that lost information.
Unless companies implement “a system that can deal with the volume of data created every day, they will continue to be challenged,” said Frank Perez, chief executive officer of Sfile, a software firm that has set out to help operators make the most of their data.
Perez noted an instance when an operator asked Sfile to train its system to identify and collect all of the company’s hydraulic fracturing pump curves and transform them into a normalized data feature set. The operator initially estimated that it had 10,000 pump curves, but, after Sfile got a hold of its data, it determined that the company actually had 65,000. “We were able to facilitate a massive database of pressure information that was used to basically build a new reservoir model,” he said. “It was just something that they didn’t even expect they had.”
It is a common trend observed by Perez: Companies have way more data than they realize, and the possibilities that come with leveraging that data are endless. But those companies first need to be able to harness the data they know they have.
Spider Bots Crawl for Insights
Ashok is part of a team working under the University of Texas’ Rig Automation and Performance Improvement in Drilling (RAPID) consortium tasked with analyzing the unwieldly drilling data contributed to the department by its operator sponsors, which in return seek insights they otherwise would not be able to find on their own. “They give us data, we analyze it, and we give them feedback,” said Ashok.
After first receiving the data, Ashok’s team can usually provide an initial report with bare-bones information to the operator in 2 weeks. But it takes 2–3 months to really “get a good handle on the data and results,” he said. This is because drilling datasets are highly diverse and come from many different sources, ranging from survey and well plan information and daily morning reports to real-time and memory-based downhole sensor data.
The challenge undertaken by industry data wranglers has been to compress the time needed to process the data while presenting it in a way that is valuable to the owner. RAPID’s work on this front kicked off when Hess contributed a big dataset from its Bakken Shale operations in North Dakota with the hope that RAPID could figure out a way to accelerate learnings from it.
“That’s what got us to think about how we could write scripts to push out answers,” Ashok said. “And that’s when we figured answers alone were not sufficient—perspective needs to be given,” which led to development of a storyboarding concept.
For years in the film industry, directors would use storyboarding as sort of a visual script, depicting how a scene would play out before it would be shot. In the data sphere, the same idea is used to present answers to complex questions from big datasets in a visual format that is easily understood by the user. However, for it to happen, data must be processed efficiently in the background.
Enter spider bots. Created and utilized by internet search engines such as Google, spider bots are another term for web crawlers, which automatically canvass the billions of websites in existence, gather information, and index them (URTeC 2902181). When a user searches for something on Google, the information that appears on the results page is a product of Google’s bots having already registered those sites, condensed the information, and sorted it into an index table.

When applied to drilling data, the same concept is at work. The system that Ashok’s team built consists of a set of scripts that run through a database to index it, allowing the user to get answers to their questions quickly. RAPID tested its approach on another dataset provided by Apache that was taken from a five-well pad in the Permian Basin of West Texas and southeastern New Mexico.
Ashok said that RAPID made MongoDB its database choice because it is free, meaning it is accessible to student workers; and is noSQL, meaning the data are managed in a quicker and more flexible manner. And there are plenty of free MongoDB tutorials online, he explained, so it is easy to learn.
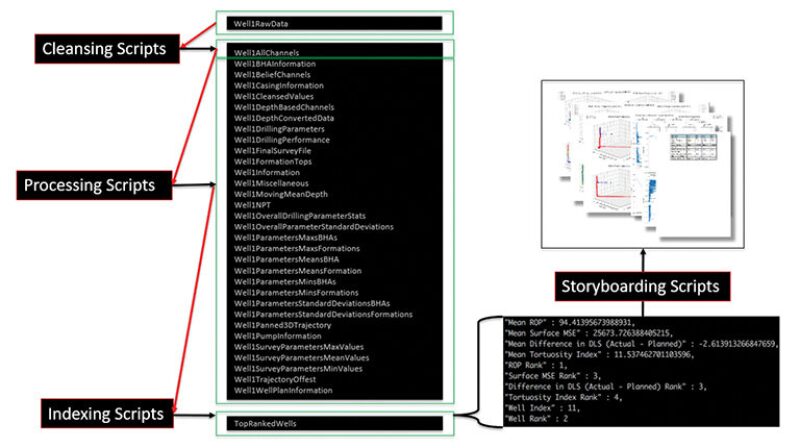
MongoDB stores BSON documents, or data records, in what it calls collections, a combination of cleansed data, processed data, and indexed data, each of which has an accompanying script, or bot. In coming up with collections, the team had to figure out which questions it wanted answered and the key performance indicators (KPIs) required to answer those question.
The three spider bots work as follows:
- Cleansing bots. Data are typically recovered from all kinds of sources and can appear in many different formats. At the same time, the quality of data can vary depending on factors such as sensor reliability, biases, and drift in different downhole and surface conditions. Data can be labeled differently and measured in varying units. These bots ensure the data are accurate, cohesive, and ultimately worthy of inclusion in the database.
- Processing bots. The next step is to contextualize the data by introducing KPIs and turning out descriptive statistics. For example, a collection named “WellSurveyParameterMeanValues” was created to provide insight on directional drilling performance. Another collection named “Well1DepthConvertedData” contained depth-based information about the well, requiring the conversion of time-based data to depth-based data.
- Indexing bots. After data have been cleaned and sorted into different collections, these bots step in to allow multiple aspects of a well or multiple wells to be compared, answering questions such as which well had the best tortuosity, rate of penetration, or connection time. Indexing bots then assign rankings and place the results in new, separate collections. When a search is performed by a user, these results are ready to be shown.
All three bots are triggered to run each time new data are added to the database. Processing and indexing bots are also updated when new questions are entered or existing algorithms are updated. A subsequent storyboarding script taps into the indexed collections to find data relevant to a query, creating a visualization of the results.
RAPID is still developing its spider bot capabilities, but Ashok emphasized that it is modular in nature, and operators will be able to customize it to their specifications.
Massively Parallel Processing Strengthens Output
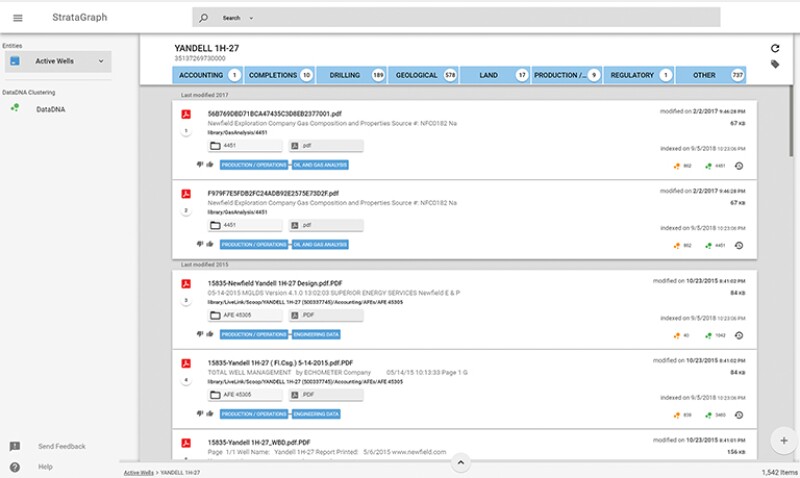
Taking a similar approach a step further, Sfile created a massively parallel-processing-backed search engine to mine through terabytes of unstructured drilling, completions, and reservoir data. Called Strata, the platform deploys thousands of bots for indexing, classification, and organization, “everything you need to basically facilitate the distilling of that data and act on it as fast as you can,” explained Perez.
Strata automatically identifies well-related documents such as daily drilling and completions reports, surveys, logs, and production reports for routing into a supercomputer, which deconstructs and maps the various feature components found in complex records, Perez said.
Once a document is deconstructed, its subcomponents are contextualized and forensically analyzed for key values or data points to further normalize understanding of what is captured in the document. Context is key, Perez said, recounting that “as recently as 2015, many people were still using drilling report templates to capture completions details. And the title of these documents would say ‘drilling reports.’” If the system does not understand what a completions report actually looks like, then it will miss this data.
“In other words, the computer reads complex documents like drilling and completion reports to extract and normalize a set of understandings in the form of high-grade data points used to feed into further machine learning modeling and analytic efforts,” he said. The multiple sets of indices that make up the engine are updated each day. All data can be searched and filtered within minutes.
User queries are similar to Google searches in which natural language processing is deployed to gain a seamless understanding of what the user is requesting. When it comes to operators accessing their big data, Perez said, “People really need search, and they need to be able to perform searches in a fast and rapid form. Because otherwise, from our perspective, if we don’t show some value very quickly, people basically get a little bit too frustrated with the time it would take to do that task.”
Sfile provides a graph representation of normalized features for categories such as wells, leases, units, and areas of interest, “with complete visibility to the data’s lineage,” Perez said.
Getting Sfile and its system off the ground in the oil and gas industry required patience through the crude market downturn and one big missed opportunity—the company successfully executed a proof of concept project with BP in 2015 with the possibility of a big contract afterward, but it fell through as the major was forced to slash its budget.
However, Perez and his team at the time also happened to be engaging with Newfield Exploration, which had just closed its Denver office and was merging its data into its office in The Woodlands, Texas. The two firms struck a deal where Sfile was allowed to mine Newfield’s data in exchange for a discounted fee, enabling Sfile to develop and hone its approach.
Sfile found that the amount of data owned by Newfield well-surpassed the operator’s expectations. Perez and his team then combed through Newfield’s entire reservoir dataset to extract and normalize data in an effort to improve reservoir models and understanding for drilling and completions. “We even built models, for instance, that tried to automatically identify errors in surveys so that we could find where the exact location of a wellbore is” during drilling.
Development of Sfile’s data platform was also aided with operator data by way of University Lands, a Texas agency that manages the surface and mineral interests of 2.1 million acres of land for the state’s Permanent University Fund (PUF), of which the University of Texas and Texas A&M University are beneficiaries.
“This provided us access to the historical and current records provided by the 300-plus E&P operators on their leases and to 100-plus years of land records,” Perez said. “Needless to say, they were instrumental in advancing our [machine learning] models.”
With that data load, Sfile “built a system to identify, deconstruct, classify, and cluster all the terms and obligations for all historical lease and unit records,” he said. “And then we developed a huge multidimensional graph analysis to identify any historical breaches in compliance with continuous development agreements—all the way down to the original permit agreements issued in the 1920s.”
Perez and Sfile will have even more case studies and insights to report following their current work with three large independents, and the firm expects to engage with another five operators this year.