While waiting to give a presentation at an industry conference last year, Dale Logan was sitting in his chair listening to one of the speakers lined up ahead of him. The man at the podium was describing an emerging fracture diagnostics system that analyzes the “noise” coming out of a hydraulically stimulated well to measure the size of its fractures.
“I’m just as skeptical as the next guy,” said Logan, a 31-year field operations veteran turned senior vice president of marketing for C&J Energy Services in Houston. “So I said to him, ‘Look, if this stuff is really as good as you guys say it is, then I’m interested.’”
The technology that caught his eye that day comes from an Austin-based startup called Seismos. The chance meeting led to more. Then late last year, the Houston-based pressure pumping company (which will soon become the third largest in the US after its merger with Keane Energy Services) and the startup of fewer than 40 people began working together in the field.
Their experiment was to see if combining C&J’s relatively new drilling data-based completions advisory tool with Seismos’ wellhead-based acoustic analysis proves out the value proposition of both technologies at the same time. Success would be convincing operators that there is a way to predict the relationship between rock properties, fracture half-lengths, and near-wellbore conductivity—opening the door for geologic-based, or “engineered completion” strategies.
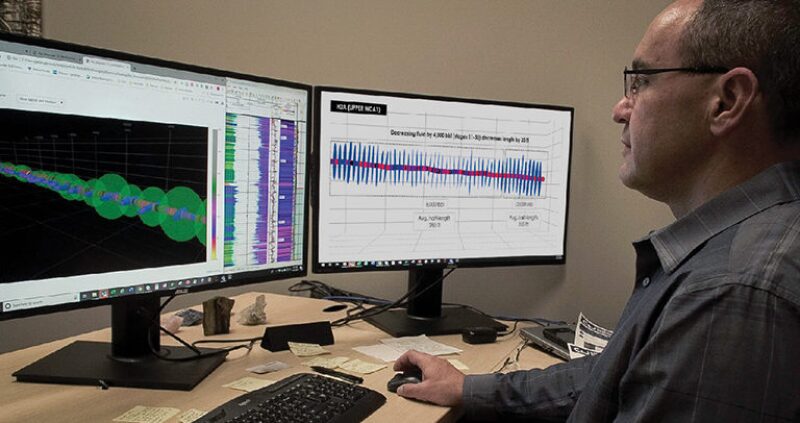
A new look at fracturing shows how drilling-based data (mechanical specific energy, or a “pseudo log”) that identifies rock strength can be combined with acoustic measurements. Red sections indicate the hardest rock, while blue lateral lines show estimates of fracture half-length. Green spheres show engineers estimates of near-wellbore conductivity. Source: C&J Energy Services.
The project has borne fruit, but it remains a work in progress as the two companies make sure they know how best to use their data sets together. “It’s not that easy,” said Logan on the pains of the validation process. “You come up with something new, you show people the answer, and then they ask how do you know if it’s right?”
To zoom out here is to see that this partnership is but a single team in the race to revolutionize how the shale sector monitors and executes multimillion-dollar hydraulic fracturing operations. Taking part are at least a dozen service companies and new technology developers that are importing advanced computing and communications technologies that have proven to work in other areas of the business.
The objective of these firms is to shed new light on what fractures look like, where they going as they are made, and how much profit they are likely to generate—or lose. Some are aiming to serve up these answers in real time, others, a few minutes after each fracture stage is completed. Either way, the fracture analysis can be used to guide a well completion as it unfolds.
In July, the exhibition floor of the Unconventional Resources Technology Conference (URTeC) became the physical manifestation of these grand ambitions.
Service providers used the gathering in Denver of more than 6,000 petrotechnicals to unveil new software platforms that manage and integrate hydraulic fracture data, which does not have a formal standard across the board as in the drilling sector. Also on display were new ways to capture fracture data.
Houston-area startup Deep Imaging is seeing increased uptake of its emerging service that uses electromagnetic fields to monitor where fracturing fluids and proppant flow during the completion. This summer, the firm began testing its ability to process and deliver its unique analysis to completions teams in near real time.
Meanwhile, a significantly cheaper alternative to permanently installed fiber optics—known to deliver some of the richest downhole data sets—has emerged too. UK-based Silixa is reporting rapid adoption of its wireline-deployed fiber optic system that was commercially introduced in February. US shale producers are flocking to the temporary fiber installations to get a real-time look at the geomechanical responses occurring between horizontal wells during the stimulation.
All of these developments are arriving into the market place as shale producers adopt new business models that favor low-cost operations over producing as much oil and gas as possible.
The technology providers touting real-time or near real-time solutions today uniformly acknowledge that by and large, their market is not ready to adopt “on the fly” changes to a completion strategy. Nevertheless, they are betting that shale producers will eventually get to a point where they are at least showing up to the field with contingencies on how to react to the new measurements they are gathering from below.
“This idea that somehow you’re going to do a different frac design on every stage, I don’t think the field will ever be ready for that,” said Logan, noting that there are a number of unresolved change-management issues on this front. “But if you could have two or three different treatment design options in each well, then I think they could tackle that.”
Fracture Diagnostics Is Now a Platform Business
In a bid to make its brand of fracture and reservoir data more relevant to every new horizontal well, Microseismic was one of several companies at URTeC announcing a new software platform for completions data. The company formed a new subsidiary called FracRx to roll out the service that uses real-time monitoring and reservoir models to create different scenarios for each fracture stage. The software-based service relies on historical production data, and incorporates other sources of information such as offset pressure data, fiber optics, and well logs.
The process involves building type curves that try to identify what it takes to maximize each stage’s net present value (NPV)—considered by many today to be the definition of the economic “sweet spot.” This might mean that an operator should keep pumping a stage beyond its original schedule, or pull the throttle back earlier than planned.
“The ultimate goal is for us to say during the stage, ‘OK, you’ve reached your limit and NPV is now going down,’” said Peter Duncan, the chief executive of Microseismic, who added that the company was pulled into the platform business in part by clients that want to take fragmented reservoir and fracture data and put it all into a single environment.
Reveal Energy Services, an offset-well pressure monitoring startup, was also introducing to the market another new analytics platform that is similarly focused on capturing and analyzing what happens during each stage in the lateral.
The big push from the technology vendors is that if operators want to delve into stage optimization, they must start managing the fracturing data accordingly. “Otherwise, we are fooling ourselves that we can make stage-by-stage decisions without access to that stage-by-stage data,” said Sudhendu Kashikar, Reveal Energy’s chief executive.
Earlier this year, the company released a separate product that interprets pressure signals from pad wells automatically. As more engineers pay attention to pressure data, one of their chief desires is to have the data interpreted by an algorithm instead of someone’s eyeballs. Reveal’s attempt at this focuses on defining whether pressure responses are direct interwell connections or fracture interactions, commonly called frac hits. The software tool also notifies operators if the pressures indicate less concerning poroelastic responses that may indicate that the formation is merely being squeezed, but not transferring fluids from well to well.
Well Data Labs has been offering a completions platform since it was founded in 2014. This spring, the company introduced its first real-time version of the software service. Rather than seeing Reveal as a competitor, Well Data Labs considers the company to be “coopetition.” The two firms spent weeks working together this year to develop an API—or an application program interface—to allow mutual customers to access their data from the vendor’s databases. This gives clients the ability to choose the portal that they view that data in, reducing screen fatigue. With APIs, clients can choose which vendor’s portal they view the data in, reducing screen fatigue.
The efforts to acquire fracturing data as fast as possible and make it easy to integrate no matter the service provider is reminiscent of a trend that has been gaining momentum for years in the drilling sector.
Corva is one of the industry’s newest software companies and is reaping big benefits from this fast-moving development. Founded in 2014, the startup’s API-friendly drilling analytics platform has soared from just two rig installations to 250 in the past year. At URTeC, Corva revealed that it is now trying to replicate that success in the completions sector with a new platform that, upon release, had 20 apps to monitor key treatment parameters and offset well pressures.
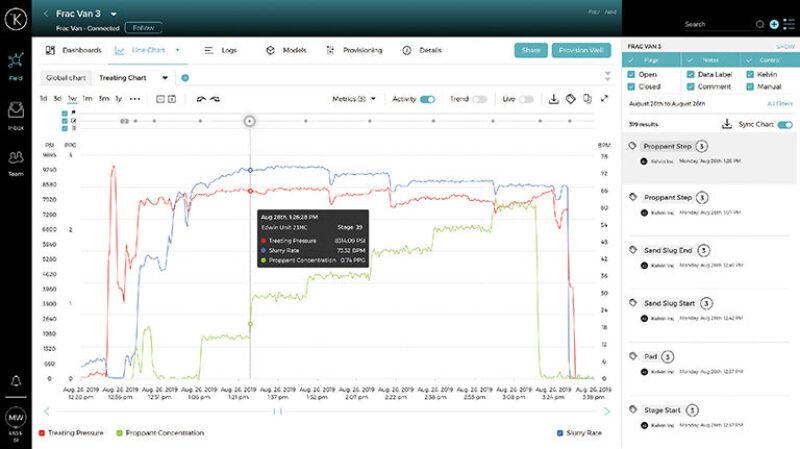
This interface may well represent how engineers monitor and dissect hydraulic fracturing data in the near future. It is
just one of several new platforms designed to bring the completions sector in line with the real-time data revolution
first achieved in the drilling sector. The keys are high-quality data and the ability to recognize what the responses
between treatment and well pressures is telling you about the performance of the stimulation. Source: Kelvin Inc.
Making Good Fracture Data Great
Not to be left out of this digital trend are the instrumental rental companies that are also rebranding themselves as platform companies. John Kalfayan, a business development manager with Reservoir Data Systems (RDS), summed up the mission: “We want to be seen as the data guys.”
The 15-year-old company has been watching its chief business driver in recent years become offset well monitoring as operators invest more in building a library of frac hits to understand the sensitivities of their formations.
RDS and other pressure monitoring companies have found that while their data is becoming increasingly valuable, raw pressure plots simply take too long for an operator’s technical staff to assemble in a meaningful way. In response, RDS developed the new user-friendly platform that aggregates pressures from multiple wells and visualizes it for end users on their smartphone, tablet, or desktop.
A newcomer to the completions sector is Silicon Valley-based Kelvin Inc. The company is mostly known in the upstream sector for its work with BP and Anadarko on artificial lift optimization. But Chief Executive Peter Harding emphasizes that his company’s “intelligent control platform” is extensible to all parts of the oil and gas industry, and outside of it, too.
Earlier this year, the startup introduced its own stage-level completions platform that is being used in the field today. The service was conceived after Kelvin’s oilfield clients on the production side of the business relayed the poor state of the sector’s fracturing data.
While appreciating the nuanced challenges, Harding said the average fracturing spread in North America “lacks some of the characteristics that you would normally look for to have a very high-quality, consistent [data] stream, and consistent time stamp.” When these elements are missing, he added, “the problems begin to be significant.”
The point about time stamps is a nuance that operators and service companies have started to acknowledge as a setback to industry efforts to analyze downhole data, especially the interference signals seen leading up to and during a frac hit. The issue centers around the time-drift that sensors and machinery clocks suffer from in the field—which was never a big problem until today.
“We absolutely see that being a challenge, and it’s particularly relevant when you’re talking about real time,” said Harding. “You need to make sure that at that point of creation, you have the data picked up and behaving in a way that is consistent.”
Ensuring that the data are good is the first step. Making it easy to analyze moves it closer to great data.
On that front, Kelvin is among those using pattern-recognition programs along with human classification. The concept is that engineers or technicians will see a specific pressure response in a well offsetting the treatment well. The slope of interest could represent a fracture interaction, or the signs that lead up to one. The role of the human is to label that signature with context. “With a growing library of events and labels associated with them, we can look for those events on an automated real-time basis as we move ahead,” said Harding.
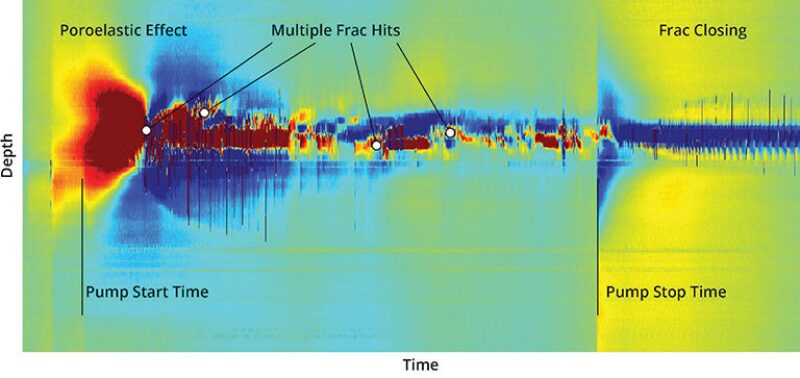
This image was recorded by a distributed acoustic sensing wireline-based system from within a monitor well. Measurements are taken every meter inside a horizontal well. Large strain variations indicate frac hits are taking place. Source: Silixa.
Missing Links: Data Standards and APIs
Among companies that would normally be competitors, mutually beneficial partnerships are forming. The coopetition model is considered by these companies to be critical to the business since no single diagnostic can reveal the relationship between stimulation design and how a segment of tight rock shears apart.
At the vanguard of this push is Well Data Labs, which has formed partnerships with several service providers, including some vendors that have created their own completions platforms. Well Data Labs has been working with these firms to create the sector’s first set of APIs that will connect the various vendors’ data streams into whatever web-based software an operator prefers. The data are related, which is why it is helpful to get it all onto one screen if possible.
Joshua Churlik, the chief executive of Well Data Labs, predicts that the API movement in completions will eventually gain critical mass as competitive motivations give way to the idea that doing what is best for operators means giving them these integrated systems. “It’s a digital ecosystem,” he said. “The operators and the service companies own the data, but these systems should plug into each other and work smoothly. It’s going to be APIs—and well-documented APIs—that make it all work.”
But there are hurdles to this effort, and taking lessons from the drilling sector is not entirely an apples-to-apples exercise. “APIs exist on every single drilling rig—but there is a basic level of data quality that comes with that,” explained Churlik. “The frac sector does not have a basic data standard from data van to data van, or even crew to crew within a single service company.”
This is a reference to the fact that WITSML, the data standard most used for drilling data, has been in limited use in the completions sector. Fracturing reports are most commonly delivered in unstructured PDFs, which has led several large independent operators to invest in advanced machine learning programs to tie them all back together—costly projects that take months.
These big data issues prompted Well Data Labs to start working more than a year ago on a software that would standardize the data streaming off any hydraulic fracturing job. This an area that Kelvin Inc. has been working on as well for its platform in order to increase the quality and usability of fracturing data.
For Well Data Labs, the task was far from simple since service companies use different labels for the same key data sets (pump rates, proppant loadings, chemical volumes, etc.). Well Data Labs has found that sometimes there are dozens of data channels streaming off a completions site without ever being labeled. Operators can still see the values of what is being measured, but if they are not assigned to a specific sensor then it becomes a headache to figure out what they really relate to.
Well Data Labs’ reverse-engineering of these data tags is now complete for all the service companies in the US. Operators that push their data through the company’s platform now see a standardized feed for every well, no matter how many different pressure pumping companies they may use to support their program.
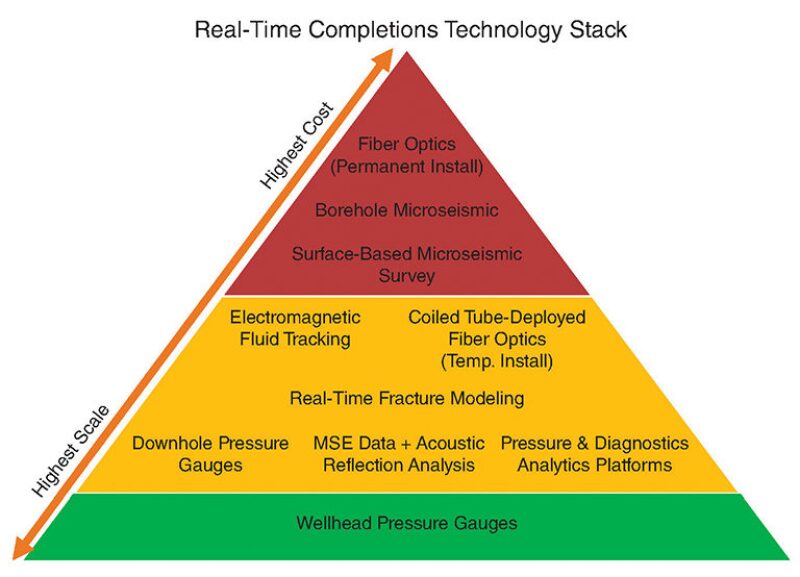
Cost and Scale
The data efforts being made are all in support of an expanding toolbox that operators have to work with for stage-by-stage completion strategies. The technology stack, some components of which are still coming into their own, could be viewed as a real-time pyramid, built upon scalability as it relates to cost and ease of use. Inside are poroelastic response analysis services, fiber optics, and electromagnetic surveys of the subsurface. (Left out of the real-time pyramid are geochemistry analysis, DNA diagnostics, and tracers since they all represent post-job diagnostics.)
The foundation of the pyramid—represented by the lowest-cost and easiest-to-scale option—is considered by an increasing number of operators to be wellhead pressure gauges that are affordable enough to be used on every pad well, e.g., treatment wells and offset, passive wells. The top of this pyramid would be represented by permanent fiber-optics installations and surface-based microseismic surveying.
If pressure monitoring is taken as the base, then operators may still want to pick from one of the other technologies that form the middle of the pyramid to validate and build trust in what they think they see in the pressure slopes. Since no one data set has all the answers, some operators are currently inclined to use higher-resolution diagnostics that come with bigger price tags as “calibration technologies.” For instance, taking the analysis from fiber optics and using it to validate the measurements from offset pressure monitoring could in theory lead to a very affordable and scalable diagnostics program.
Amid the cost-effective options in the middle of the technology stack is temporary fiber-optic installations, deployed via wireline units. Silixa is among those gaining traction in this arena.
Pete Richter says when he left Schlumberger and came over to Silixa a couple of years ago, clients wanted to know two things about fiber optics: how to make it cheaper, and how to get the data in a timely manner. “With permanent fiber, there’s only a certain amount that you can reduce the costs by—they have come down, but there is still a certain fundamental base,” said Richter, a vice president at Silixa. He added that project lead times for permanent installations can also be 6–12 months in advance.
The company’s answer was a temporary fiber optic cable that could be deployed using a wireline. The system measures temperature and acoustic changes, along with cross-well strain that operators are using to assess poroelastic responses, frac hits, and nuances such as fracture cluster efficiencies. If a unit is available, Richter said the deployment time to the field could be as little as a week.
This new fiber technology—which has been upgraded in terms of resolution from previous generations—can also double as a microseismic acquisition system. In a cross-well setting, Richter said that the older systems could “hear” injections of water but the sound was a bit garbled. With the new system, “it sounds like the bubbles in a fish tank—that’s clarity,” he said. “We’re seeing data quality that we’ve never seen before.”
A number of operators at the URTeC gathering expressed enthusiasm for the temporary fiber installations since. One engineer said his company had acquired half a petabyte of data from the technology in just a few months—underscoring that these new sources of data can be quite large.
Deep Imaging uses electromagnetic arrays that involve putting 250 kilowatts of electricity into the ground to create a magnetic field miles below the surface. As that field is disrupted by the fluids of a hydraulic fracturing treatment, the changes are measured and visualized, revealing the fluid’s flow path.
The service is data intensive, which kept the analysis limited to being used for post-job studies, but the company knows the value of the data diminishes with time, so it has been investing in communication systems to move the data out of the field. To help manage and integrate this brand of subsurface information, Deep Imaging has partnered with Well Data Labs.
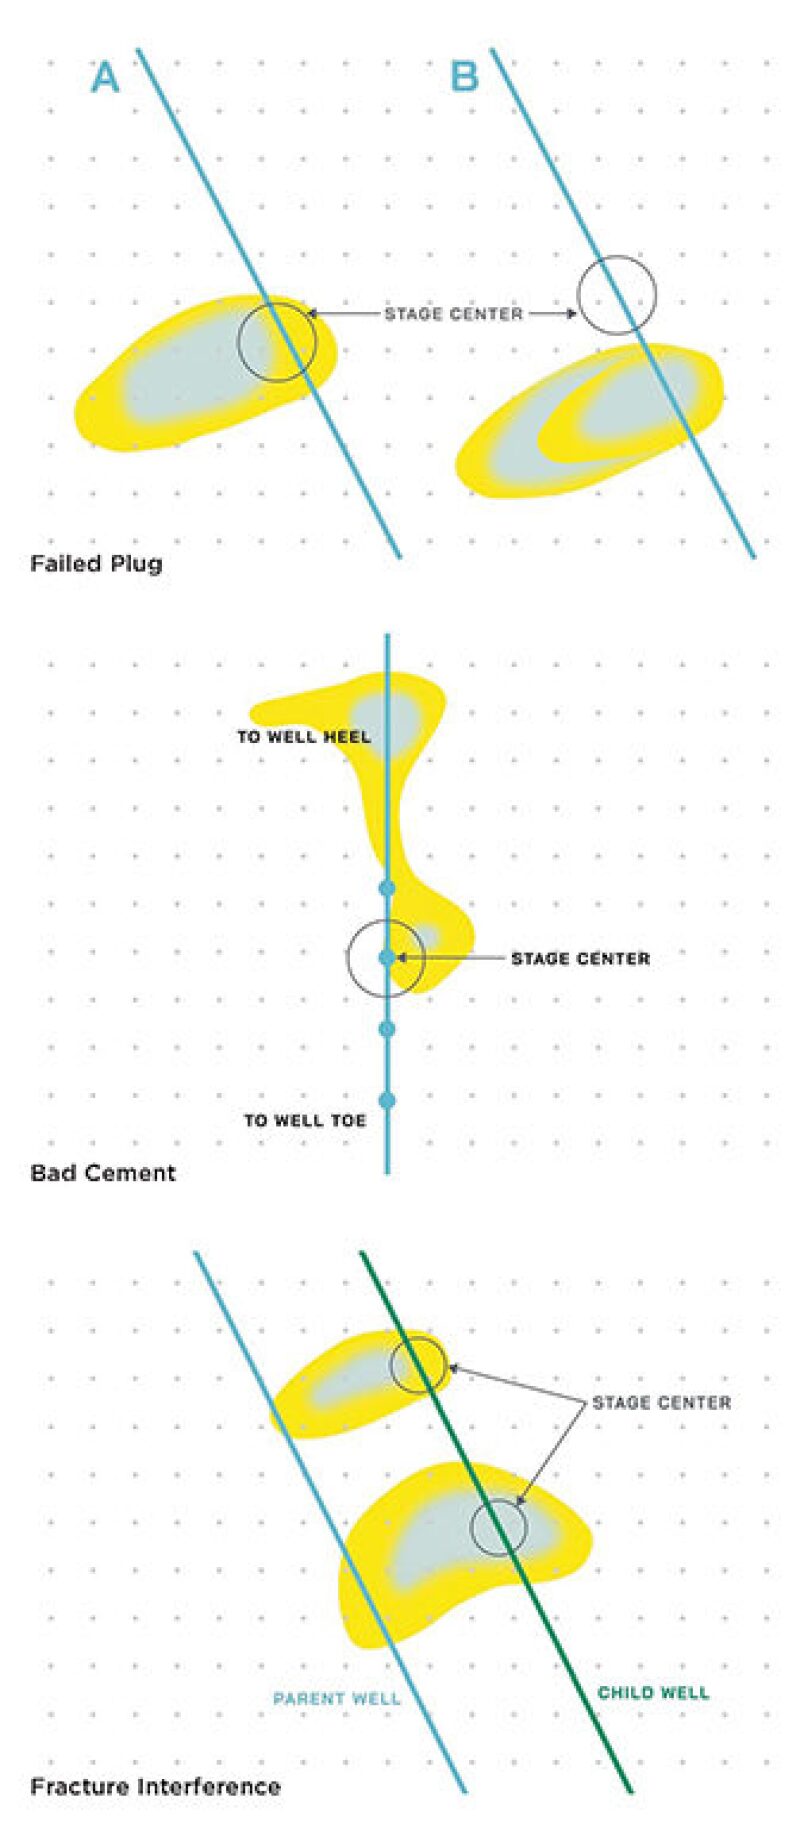
“Our goal is to put out by the end of the year a real-time frac fluid monitoring system, whereas within five minutes of water being pumped subsurface, you can see what that impact of that fluid and proppant is stage by stage,” said David Moore, the chief executive of Deep Imaging. “If you start seeing that you’re having a frac hit, or the fluid is going out farther than you predicted and is getting close to a producing or parallel well, then you could shut that stage down.”
Moore added that the company’s monitoring service regularly records frac hits, but it is also seeing the impact of plug failures and poor cement jobs that allow fracturing fluids to move up the lateral instead of into the formation. “If you have bad cement, and the fluids are just being pumped up the annulus, into the path of least resistance and a low-stress area, why wouldn’t you want to stop what you are doing and skip that stage,” said Moore. “You probably skip the next stage or two depending on how far you saw that fluid flow because when you already have fluid flowing there, every time you go to the next stage it is all going to pump into the same place.”
While it is not a data-acquisition technology, fracture modeling has a big role to play as a primary consumer of the new data being collected. FracGeo is among those that have been working for the past few years to get its model to run at speed.
“It is almost instantaneous,” said Ahmed Ouenes, the company’s founder, who explained that each new iteration of its 3D-fracture model can be run in less than 5 minutes on a laptop for a well involving up to 70 fracture stages.
Ouenes knows that obtaining more subsurface data is critical to making products like his deliver results, but he is also aware that the operator community remains price sensitive when it comes to adding anything to well costs. The problem he had to solve for clients was to figure out how to get geologic data at a low cost.
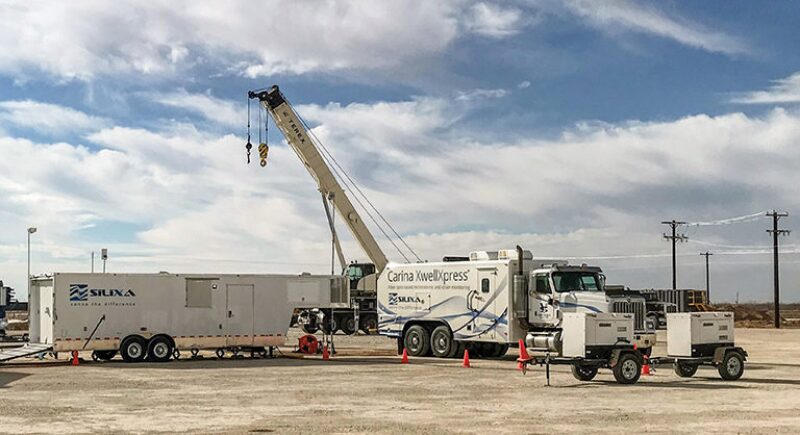
Out in the field, a small but growing fleet of fiber optic cable trucks are being used by shale producers to see the forces of hydraulic fracturing as they happen between pad wells. The system is largely used for distributed acoustic sensing and microseismic event detection, which can indicate the degree of fracture interactions happening in the subsurface—in real time. Source: Silixa.
That led FracGeo to also turn to frictional drilling data to derive important parameters for the models such as pore pressure, stress, and the presence of natural fractures. The advantage of using this MSE data, also dubbed a “pseudo log,” is that it is always available from the rig. Equinor presented a technical paper at URTeC describing how it used FracGeo’s MSE-based model to execute engineered completions in the Eagle Ford Shale in Texas.
FracGeo has also forged partnerships, including one with Carbo, which owns its own fracture design software. The two companies are integrating their software so that the MSE logs derived by FracGeo can be used to drive a real-time fracturing modeling platform. “When you put that analysis together with the modeling, then you start seeing the puzzle come together,” said Oeunes.
FracGeo is also working closely with a company called RigMinder, a subsidiary of Ensign Energy, to use the MSE logs to assist in geosteering. A third partnership is with a Russian data acquisition company called Geo Array Technologies, which has developed a “small supercomputer” to process microseismic data in the field, in near real time, and importantly, for about one-tenth the cost of some legacy services.
There are others trying to drive the use of MSE data as a scalable completions data set. C&J’s approach is to integrate MSE interpretations with the analysis produced by its partner Seismos. One technology provides an upfront prediction of rock strength, the other measures the fracture geometry (including half-lengths and height) along with near-wellbore conductivity.
C&J says that this tandem is showing clear correlations. In softer rock, the data show that fracture stages will tend to have longer half-lengths. And when the fracture stages are shorter, then there appears to be a higher degree of near-wellbore fracture conductivity—considered today as perhaps the most-desirable outcome in infill well scenarios.
As this diagnostics boom takes off, the issue of scalability is likely to play out and become much clearer over time. While MSE data may be available from every well drilled, there are hard ceilings for other toolsets. Deep Imaging is in the process of growing but currently has only two surveying fleets, with both contracted out for the rest of the year. Silixa is building more units for its temporary fiber-optics service, but at present there are just a half a dozen of these in the field.
And while offset pressure monitoring represents a small fraction of total well costs and is thus well positioned for increased uptake, there is a limiter too. At least 15,000 horizontal wells in the US are to be drilled by year’s end, according to various analysts—a number far higher than the current inventory of digital pressure gauges in the US.