Trimming the time that exists from the day drilling begins to the delivery of first oil represents a largely overlooked opportunity for US shale producers to improve free cash flow. In the Delaware Basin alone, accelerating this cycle time would save the shale sector more than a billion dollars.
This is according to a recently published study from Westwood Global Energy Group and the Project Production Institute (PPI), a San Francisco-based non-profit that promotes a method called “operations science” for major capital planning and management projects. Their findings offer a new quantitative look at the hidden costs of the shale sector’s nonproducing asset base.
The biggest issues boil down to two periods in the life of a shale well: when it is a drilled-but-uncompleted (DUC) well, and after it is completed but still waiting to be attached to a sales line. Holding too large an inventory of these dormant properties means locking up large sums of capital indefinitely. On the other hand, a lower balance of DUCs coupled with achieving initial production on a quicker basis frees more of that sunk capital to generate revenue.
DUCs and completed wells awaiting hookup are categorized in the study as a single measurable called “work in process.” This metric includes drilling and completions, but it is the nonoperational days where producers have the most room to improve. Excessive work in process also includes drilling permits sitting idle, pads that are built but not yet drilled upon, well design lead times, and other delays.
Amanda Goller, who leads research for PPI, acknowledges that while overall cycle times have remained relatively constant in spite of larger well pads and longer laterals, nonoperational time on multiwell pads is steadily creeping higher. This is attributed to the fact that, generally, the shale sector has not considered work in process an effective way to benchmark capital management performance.
“Most oil companies have scheduling software to track what their work in process is—but that won’t tell them what it should be,” she explained, adding that, as a result, “The industry does not control its work-in-process inventory.”
Goller is both the director of analysts communications at PPI and the director of analytics with Strategic Project Solution, which develops operations science software. She said this class of software deviates from traditional planning programs because it “uses mathematical formulas to tell you pretty much in real time, where everything should be every day.”
The PPI website offers this definition: “Operations science focuses on the interaction between demand and production and the variability associated with either or both.”
As evidence that operational practices are a difference maker, Goller points to the wide disparity of cycle times among the 15 largest unconventional operators in the Delaware Basin. The study found that mean cycle times across the basin are 154 days, with the poorest performers averaging 233 days from spud to initial production. The top percentile sees first oil in 88 days.
The study goes on to conclude that onshore oil and gas companies using operations science are seeing cost savings of up to 40% compared with their peers, while also realizing increases in an asset’s net present value (NPV) of up to 100%.

Delaware pad-level average cycle time in 2018 split into operations and nonoperational days.
Slimmer Backlog, Thicker Margin
A comparison between two of the largest players in the basin shows that there is a direct correlation between cycle times and the number of DUCs and not-yet-producing wells owned by each operator.
Anadarko Petroleum, which was acquired by Occidental Petroleum earlier this year, averaged a cycle time of 171 days to first production in 2018. This is based on a throughput of 106 wells per year in the Delaware. This relatively long period meant that Anadarko held about 50 not-yet-producing wells in its inventory at any given time. By contrast, EOG Resources averaged 113 days. If Anadarko had achieved EOG’s cycle times, then the number of waiting wells would have been 33.
The delta is just 17 wells. But assuming the two operators share the same fixed well costs, Westwood and PPI estimate that the tied capital in those wells is around $51 million. “Applying this logic to the top 15 companies yields annual savings of $700 million per annum. Including the other operators in the basin would bring the total savings to more than $1.2 billion per year,” the study says.
Outside the scope of the joint study, Goller has analyzed other shale basins and found similar issues. She estimates that the total amount of trapped capital equates to at least $5 billion across the US shale sector.
If operators are able to close this gap, it would represent a one-time boost in free cash flow. It would not be a repeatable exercise, so long as an operator did not once allow work in process backlogs to expand once again. Nonetheless, Goller emphasized that the lower capital costs achieved per well translate to increased NPV, which should come with a positive impact to publicly traded producers.
“The way I look at it is if we assume the savings is even just $50 million a year, and we applied that $50 million to cash flow and the result was positive free cash flow, you should get a valuation uplift to your stock that is worth a lot more than $50 million,” she explained.
A Cause of Confusion
James Jang, an analyst with Westwood, expects the findings shared in the report to aid in the industry’s understanding of what role DUCs truly play in the shale sector.
“People should not look at DUCs as a good or bad thing inherently,” he said, adding that, “there is an optimal number of DUCs, and that level is not zero.” Having no DUCs on the books would be an indicator that an operator has essentially halted the drilling of new wells and has none left to complete.
DUCs have been a source of intrigue and mystery ever since industry analysts began tracking them several years ago. Initially, DUCs were interpreted by industry observers as a possible production control mechanism that shale producers could advantageously activate when crude prices increased above the mean. This played into the narrative that the US shale sector had become the world’s new swing producer.
However, the idea that there is a “DUC bank” that operators can tap into at will has raised serious doubts from industry analysts. Some labeled the idea as “deeply misleading.” Currently, there is no consensus on how many DUCs there are in the US. Jang and other industry analysts have determined that some of the confusion stems from the flawed methodology that the US government uses to track these wells.
Jang explained that a “healthy level” of DUCs is going to be different for each operator. Determining that threshold requires a company to strike its own balance between its throughput, i.e., how many wells are put into production in a period of time (usually within a year), along with the speed at which they can do this, i.e., the cycle time.
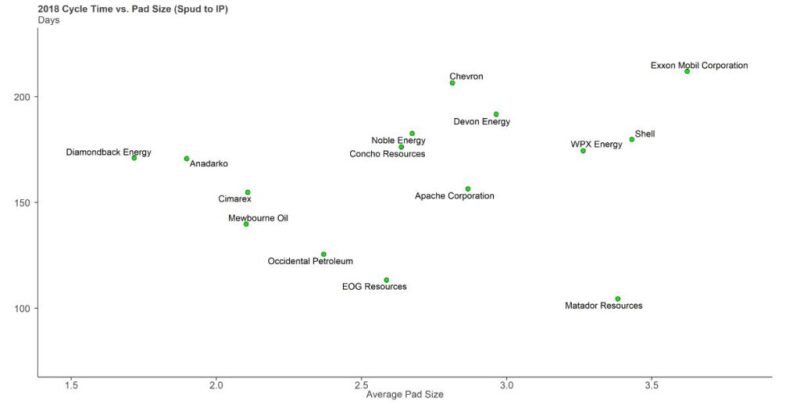
Delaware Basin cycle times as they relate to pad size by each of the top 15 operators in the region.
Rethinking the Rig Count
Some of the disparity in cycle times identified in the study are attributed to supply chain delays, equipment failures, and the weather. However, Westwood found in its analysis that top performers, which in addition to EOG includes Occidental and Matador Resources, tend to maintain a tight grip on the capital required to execute their developments.
Jang says one reason why EOG is able to bring completed wells to market sooner than its peers is partly because it owns and operates its own flowback crews. “There are pros and cons,” when it comes to operators owning the heavy equipment required to bring a well on, he explained. “Small companies can’t afford that—they just don’t have the economies of scales to realize those goals while bigger companies can definitely afford that.”
A remedy that may be easier for some to adopt involves rethinking how many rigs are needed to optimally support shale development. “More rigs do not always equate to a shorter cycle time,” said Jang. In fact, too many rigs tends to exasperate the issue.
ExxonMobil and Chevron are known to operate the highest number of rigs in the Delaware Basin and, in this study, they were found to have the two longest cycle times, respectively. On average, each company requires more than 200 days to bring a well to full production.
ExxonMobil is averaging close to four wells per pad, the highest figure of all the region’s largest producers. By contrast, operators with the fastest cycle times are drilling fewer pad wells and some use shorter lateral lengths.
Goller said operators who charge individual engineering teams with just two rigs move also faster than their peers. “If you’re only managing one or two rigs, then you don’t really need any fancy software to tell you what to do,” she said. “But when you’re managing three or more rigs, that’s when we see real issues come.”
Could slowing down rig speed also help? Yes, in certain instances.
The shale sector has spent much of the past decade trying to reduce drilling times from more than a month down to less than a week. But this means drilling tends to outpace completions. Goller said reducing rig utilization, for example, from 99% to just 94% while allocating a bit more capital toward completions could “smooth everything out.”
A shale producer using six rigs and three completions crews could also find that dropping down to five rigs and adding an extra completions crew would drive cash flow higher with the same or less capital expended.
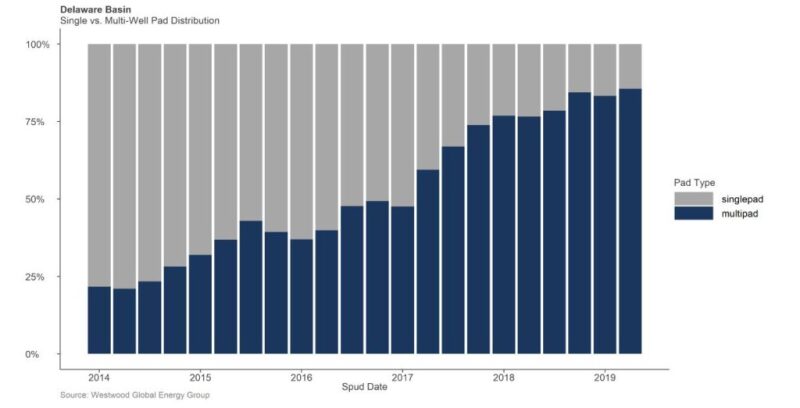
Chart illustrates the growing adoption of multiwell pads in the Delaware Basin.