Tight-oil production in the US set new records in 2019, but the banner year ended with an important caveat: more than two-thirds of crude production from shale plays flowed from wells drilled in the past 2 years. The figure reflects the fast-paced life of horizontal wells while also highlighting that older assets are not contributing as originally expected.
Wells brought online since the start of 2019 represented 45% of total US tight-oil production—3.5 million B/D out of an all-time high 7.74 million B/D. As more late-year production data flows in, the 2019 wells might represent closer to 50% of the total, according to information from ShaleProfile Analytics, a firm that aggregates public data from US oil and gas regulators. Another 25%, or about 1.9 million B/D, came from wells that started producing in 2018.
The remainder of US onshore supply came mostly from the 93,000 wells that were completed between 2010–2017. The importance of this older stock of horizontal wellbores is coming into focus as the early-time-decline rate of new wells accelerates, prompting upstream analysts at IHS Markit to forecast that US tight-oil production will peak in 2021.
Unconventional wells in the most prolific shale plays tend to see decline rates of more than 50% in their first year, and another 30% in their second. One of the key assumptions that justified the long-term economics of such production profiles held that, after about 5 years, those steep declines would transition to the modest 5–10% annual drops seen in conventional wells, and remain there for many years.
The most recent production data reveal that tight oil wells are not living up to this standard.
At 5 years of age, horizontal wells in the Permian Basin and Williston Basin’s Bakken Shale share average decline rates of around 17%. The figure for wells of the same age in the Eagle Ford Shale is 23.5%. On average, it takes 8–10 years for many of these wells to fall below an annual decline threshold of 10%.
These high late-stage decline rates represent a clear challenge for current reserves and ultimate recovery estimates from wells that were expected to produce economically for 30 or more years.
As a result, shale producers are now advised to not use conventional wells as a guide, or else run the risk of overstating and overvaluing unconventional assets (URTeC 432). The sector’s awareness of long-term production shortfalls is also considered to be the driving force behind a new wave of mergers and acquisitions that has left constrained operators seeking to combine with peers holding proportionally large positions of undrilled acreage.
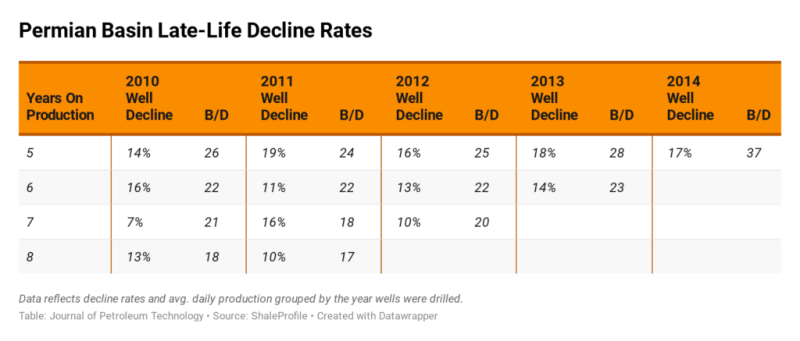
- At 5 years of age, horizontal wells in the Permian see decline rates fall to an average of 16.7% and will produce just under or about 30 B/D. This is based on information from more than 5,800 wells.
- Average daily production of a 5-year-old Permian well jumped more than 41% as activity in the play matured. Lateral lengths have nearly doubled since horizontal drilling began while average proppant loadings soared. A 2013 Permian well used about 800 lbs per foot compared with an average 2017 horizontal oil well that used 1,800 lbs per foot.
- At 5 years of age, the 2014 group of Permian wells show a higher decline rate than wells drilled in 2012 or 2010 did at the same point. But 2014 wells showed stronger initial production, which lifted their 5-year cumulative production compared with earlier vintages.
- This translates to an average production of 37 B/D for a 5-year-old 2014 well vs. an average of 25 B/D for the 2012 well group. Over the life of a well from the two groups, the difference in cumulative production is respectively about 148,000 bbl per well compared with 102,000 bbl per well.
- Between 7 and 8 years of age, decline rates begin to fall to around 10%—however, as demonstrated by the 2010 group, average decline rates in shale wells can bounce back up. There are about 2,100 horizontal wells in the Permian 7 years old or older.
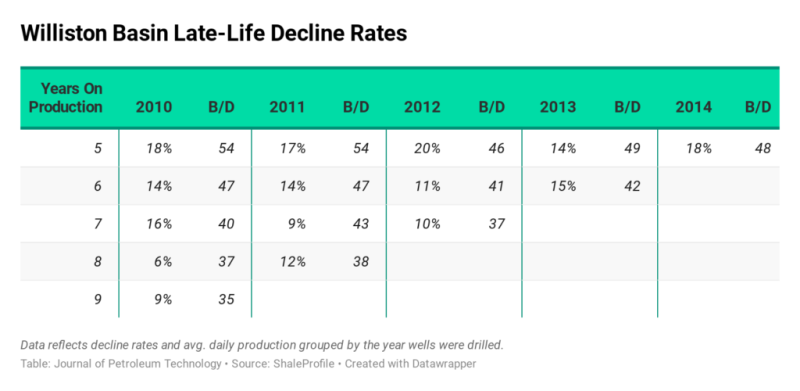
- The average 5-year-old horizontal well in the Williston Basin, which encompasses the Bakken and Three Forks shales, shows an annual decline rate of 17%. This is based on data from more than 10,500 wells.
- At the 5-year mark, these wells average 49 B/D— the highest such figure of the three major tight-oil plays in the US. However, the 2014 grouping produced an average of 48 B/D at age 5 compared with 2010 and 2011 well groups that averaged 54 B/D at age 5.
- As is also seen in the Permian, annual decline rates do not necessarily stay on a downward trajectory. While maintaining roughly the same number of well counts year over year, the 2010, 2011, and 2013 well groups both saw late-life upticks.
- The sharpest drop from year 5 to year 6 occurred in the 2012 group, which recorded a decline rate of 9% year over year.
- Average decline rates for the 2014 group of wells, which just turned 5, was nearly 4% higher than the figure for the 2013 group.
- Because initial production rates were higher in 2014 wells, their cumulative output is stronger than the older vintages, although modestly. The 2014 wells recovered about 10% more oil than 2012 wells, but performed similarly to 2013 wells.
- At 5 years, the 2012 group averaged a cumulative production just shy of about 175,000 bbl. The figure improved to 190,000 bbl for the 2013 group and then 194,000 for the 2014 group.
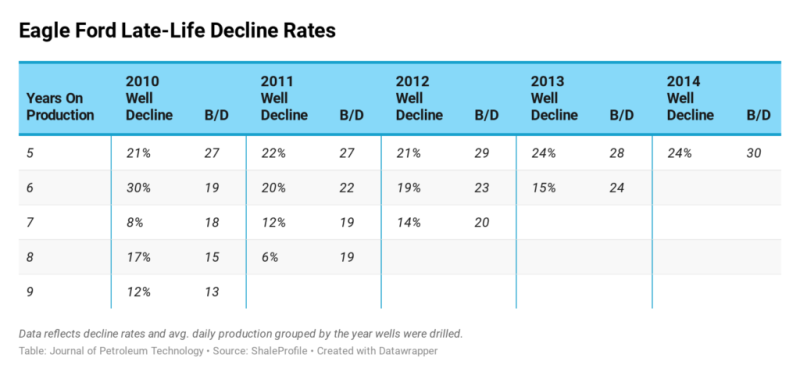
- The average decline rate of horizontal wells in the Eagle Ford Shale at age 5 is about 23.5%—the highest such figure of the three major onshore oil plays in the US.
- At age 5, the average well in the play produces 28 B/D. A comparison of the daily output of 2010 wells at age 5 vs. that of the 2014 well group shows a 10% improvement.
- The 2010 well group represents the smallest sample size and also features the most inconsistent trend in decline rates. In 2010, only 358 wells were reported as being completed in the Eagle Ford.
- At around 5 years, the 2014 group averaged a cumulative per-well output over 171,000 bbl compared with the 155,000 bbl that flowed out from the 2013 group after 60 months. This 10% bump in cumulative production corresponds to a period when operators began stepping up from about 750 lbs of proppant per foot of wellbore to about 1,200 lbs per foot.