The makeup of the US energy sector is on the fast track to diversification—placing natural gas and renewable sources in a head-to-head race over the next decade for the nation’s most dominant source of electric power.
Meanwhile, the future remains bright for US oil and gas production as well as the country’s newly established export profile. A critical byproduct of the energy transition will be lower to only modestly growing CO2 emissions.
This is all according to the US Energy Information Administration’s (EIA) Annual Energy Outlook 2020 that is used by government officials to steer energy policy and the business world to guide future investments.
The EIA outlook contains several possible pictures of the future that all rely on several hard-to-predict factors. One of the most sensitive of those inputs is US gross domestic product (GDP). The EIA notes that small changes in the economic cycle could bring big changes to US energy consumption.
The base case—i.e., the most plausible scenario—holds that US energy demand will grow by only 0.3% per year to 2050, which is significantly slower than the projected 1.9% average annual growth in US GDP. The divergence of these historically linked figures is expected to be the result of increasing energy efficiency in the US. All references to base case scenarios also assume the continuity of current US laws and regulations as related to the oil and gas industry.
The full report can be accessed here.
Rapid Growth In Renewable Energy Is Now
Driven by a mix of government incentives and falling capital costs, the EIA’s base case projects that the share of renewable energy supply in the US will double from 19% last year to 38% by 2050. The figure shows the EIA's growing confidence in the renewable sector. In the agency's 2015 outlook, the base case projected that the share of renewable energy supply in the US would not reach 18% until 2040.
Even after existing tax credits expire, the EIA now believes that manufacturing costs of renewables will continue to drop, removing any friction that would otherwise slow down installations. The arena of solar power represents the bulk of the upward curve, nearly tripling its contribution of renewable power generation from 14% in 2019 to 46% by 2050.
A more diversified grid will come at the cost of coal and nuclear power plants, which in recent years have lost their economic competitiveness to renewables and natural gas.
But natural gas will not be immune either. The EIA’s base case shows that sometime in the mid-2040s renewable energy in the US will overtake electricity sourced by gas-burning power plants.
This important milestone could be reached even sooner.
The EIA’s low-cost model projects renewables to be the number one source of electricity in the US by the mid-2030s. Natural gas, coal, and nuclear power would then see flat growth or declining growth into 2050.
This scenario is not considered to be the most likely, relying on a 40% reduction over the next 30 years in renewable costs as the result of learnings and innovation. This is compared with the EIA's base case which does not foresee innovation playing a major role in cost reductions.
But as evidence that the EIA has historically underestimated the ability for renewables to scale, the base case in the 2015 energy outlook projected that renewables
Because of the expanding energy mix and the retirement of coal-fired plants, the US will continue to record lower CO2 emissions from energy generation. This trend will last until 2030 when CO2 emissions rise once again due to a projected bump in energy demand, mainly from the transportation and industrial sectors.
If the US economy were to see higher economic growth, then the EIA models suggest CO2 emissions will rise 13% above its base case estimations. Similarly, if the US experiences slower than expected economic growth, the country’s CO2 emissions may be 11% lower than the base case offers.
Other key takeaways:
- US adds 17 gigawatts of new wind and solar capacity between 2020 and 2023—the result of tax credits, sustainability targets, falling capital costs.
- New wind capacity slow only modestly after tax credits expire in the next few years; solar capacity growth rises steadily for both grid-scale and small-scale applications.
- Natural gas-fired power plants expand capacity to compliment rising demand.
- Most of the retirements of coal-fired plants take place by 2025; remaining capacity considered efficient enough to remain in operation.
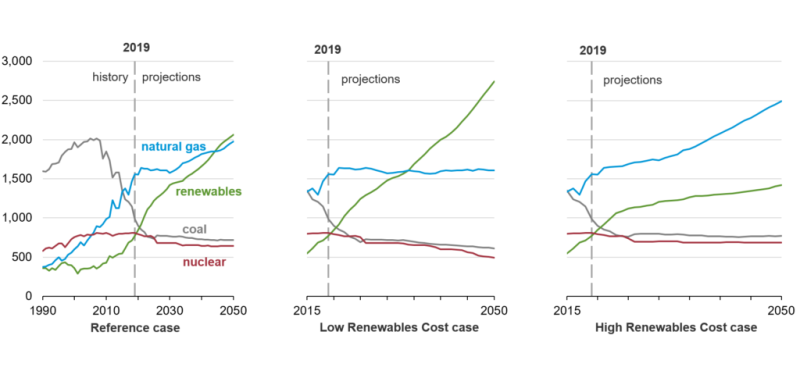
Changes in the cost assumptions for new wind and solar projects result in signifcantly different projected fuel mixes for electricity generation. Source: US Energy Informaiton Agency
US Oil and Gas Production Drives Forward
As the energy transformation picks up momentum in the power sector, the US remains on track to maintain historically high levels of oil and gas production. This means that production growth will outpace consumption growth for the foreseeable future.
The outlook’s base case expects US crude production will set annual records in the short term, topping out at near 14 million B/D by 2022 and remaining at or near that level for at least the next 25 years. Similarly, dry gas production is trending toward 45 Tcf by 2050. Both assumptions rely on the sustained economic development of US tight oil and gas fields.
EIA’s base case also says that US will reach an export peak of about 3.8 million B/D of crude oil and other unrefined liquids in the early 2030s. This figure will retreat to just 200,000 B/D by 2050, partly the result of increased domestic use.
Natural gas exports via pipeline to Mexico and Canada, or via LNG facilities to the rest of the world’s markets, will continue to increase until the end of this decade. US gas exports remain relatively flat from there to the end of the projection period.
Other key takeaways:
- Onshore tight oil production accounts for about 70% of the cumulative production in the EIA’s base case.
- The vast majority of crude production growth will come from just two states: Texas and New Mexico. All other oil basins in the Lower 48 states will halt growth or see declines by mid-decade.
- The US Gulf of Mexico will reach a record output of 2.4 million B/D by 2026 and continue to increase until 2035 before peaking and entering a state of decline around 2050.
- Gasoline-fueled road vehicles decline from a 94% share in 2019 to 81% in 2050—meaning internal combustion engines will continue to dominate the US transport sector.
- Sales of long-range electric cars will increase from 2019’s figure of around 280,000 to 1.9 million annual sales in 2050; hybrid-vehicle sales will trail in growth, rising from just 137,000 sales in 2019 to 230,000 in 2050.
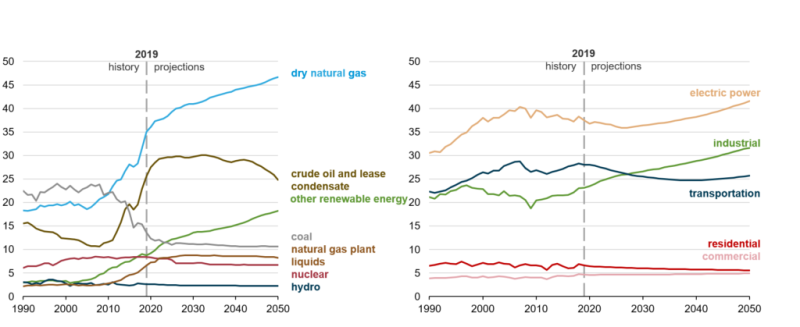
Projections for the source of US energy production growth are shown on the right graph. Energy consumption by sector is shown in the left graph. Source: US Energy Information Agency