With the oil price market slowly recovering in recent months, hydraulic fracturing activity may increase at faster rates than previously expected. However, even with higher oil prices, operators in shale plays still face significant budgetary issues with regards to water management. As demand and usage increase, and saltwater disposal wells (SWDs) fill to capacity, companies looking to stay afloat will have little choice but to find alternative means to store and reuse their produced water.
“Costs will go up, and the industry needs to be prepared,” Piers Wells, chief executive officer of Digital H2O, said. “What this drives us toward is the conclusion that increased water reuse will likely be an operational necessity in a recovering oil price environment.”
This article examines some of the water management issues facing companies in the Permian Basin and the Bakken, two plays with different geologic features but similar needs to handle rising produced water volumes.
Permian Issues
The downturn put stress on operators in the Permian Basin, but despite the financial difficulties hydrocarbon and water production remained at high volumes. Digital H2O, a company that specializes in oilfield water resource forecasts, claimed that this was primarily due to the large number of wells completed between 2012 and 2014. Over the same time period, water intensity has gone up. In a company webinar, Wells said that the amount of water used per well completion has increased, and more water has been generated per well and per horizontal foot of wellbore length.
While completion activity has led to an increase in water intensity in the Permian, the basin’s SWD capacity is facing heavy constraints in key areas. Wells estimated that the average pressure utilization for SWDs was 65% in 2016, with several wells reporting utilization approaching 100%.
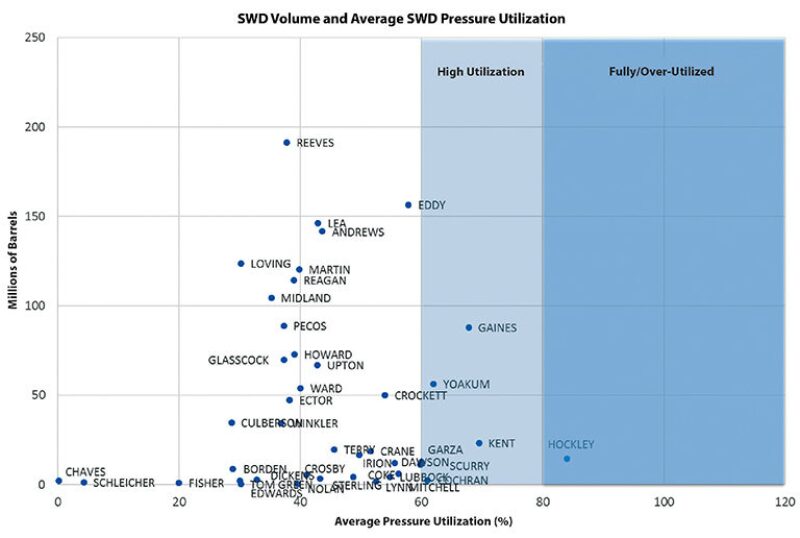
Fig. 1 illustrates the average monthly water volume disposed in an SWD compared to the average pressure utilization for SWDs for each county in the Permian Basin. A range of 60% to 80% utilization is considered high, and anything above that is considered full utilization, meaning that the wells in that county cannot accept any additional water for disposal. Wells identified four counties—Gaines, Yoakum, Kent, and Hockley—that are either at high or full utilization, with several other counties nearing the lower bound of the high utilization range.
Wells said that SWD pressure utilization shares a fundamental relationship with transport distance costs, as shown in Fig. 2. The light blue line in the figure represents the median pressure utilization percentage in a given month, while the light green line represents the median transport distance in a given month. As the median pressure utilization increases, so does the transport distance. Wells said this was likely due to the fact that, as SWDs near a well producing high volumes of produced water fill up, operators have to drive longer distances to dispose of their waters in less-utilized wells. This relationship has a direct impact on water costs.
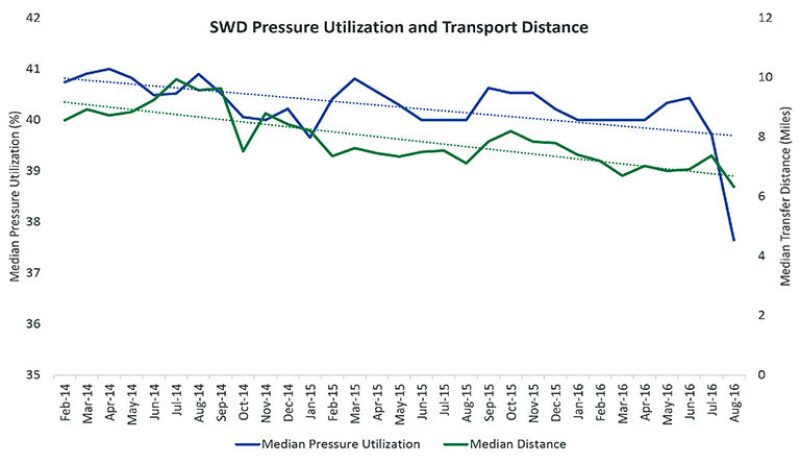
“As utilization pressure increases, transport pressure increases, therefore the cost to transport that water increases,” Wells said. “In addition, as saltwater disposal capacity increases, the fee charged to dispose that water in saltwater disposal wells also increases, so you get two factors of costs going up—water transport costs and water disposal costs driven by the capacity utilization of the installed base of the saltwater disposal infrastructure.”
Permian Outlook
At a presentation hosted by the SPE Gulf Coast Section’s Waste and Water Management Study Group, Bridget Scanlon outlined the numerous challenges operators face in reusing produced water in the Permian, ranging from the low cost of fresh water in the area and the cost of disposal relative to the costs of storage and reuse.
“Water is cheap in the Permian Basin,” said Scanlon, a senior research scientist for the Bureau of Economic Geology at the University of Texas at Austin. “We have it measured at about 25 cents per barrel. Also, the landowners want to sell fresh water and make money off of it. I would too. And then, the low costs of produced water disposal are a factor, and that doesn’t include the costs for transport. Then, of course, we’re recognizing the contamination risk of transporting and storing produced water in pits. You have to use tanks, and that’s a lot of tanks.”
Wells et al. (2017) predicted that renewed completion activity, continued drawdown of drilled-but-uncompleted wells, and high legacy well produced water volumes will drive demand for additional SWD capacity. However, given the recent slowdown in available SWD capacity, they wrote that even a slight increase in produced water volumes may lead to increasing water costs until new disposal capacity becomes available.
Presuming that the price of oil continues to rise, they estimated that water production in the Permian could increase by as much as 50 million bbl each month. If production increases by this amount, approximately 70 million bbl of produced water would need to be diverted from current disposal facilities to new facilities or be diverted for reuse. A 15% volume increase in produced water would likely lead to multiple bottleneck areas in the Delaware and Midland Basins due to high disposal utilization, with Eddy, Lea, Hockley, Howard, Reagan, and Winkler counties being the most likely areas of acute bottlenecking.
Wells estimated that areas with overly pressured SWDs under this scenario would produce 35 million bbl of water per month in the Delaware, and 22 million bbl of water per month in the Midland.
Scanlon said the Central and Delaware Basins each have enough saltwater disposal water to support hydraulic fracturing; disposal to usage ratios were 1.7 and 2.6, respectively, based on the most recent data from 2014. An increase in campaign drilling may also help limit the need for SWDs, though Scanlon said it may raise questions of ownership of the produced water.
“As the system evolves, maybe we see that happening,” she said. “There’s the issue of who holds the water—if you turn a waste into a resource, then all of a sudden somebody might want to own it—but, from a water quality perspective, there is potential.”
Bakken Issues
Fig. 3 shows hydraulic fracturing water use per length of lateral for oil and gas wells in the Bakken. The figure illustrates water use for 7,868 wells drilled from 2005 to 2013 in the Bakken and Three Forks formations, encompassing the Northwest Transitional, Eastern Transitional, Central Basin, Nelson-Little Knife, and Elm Coulee-Billings Nose assessment units in Montana and North Dakota.
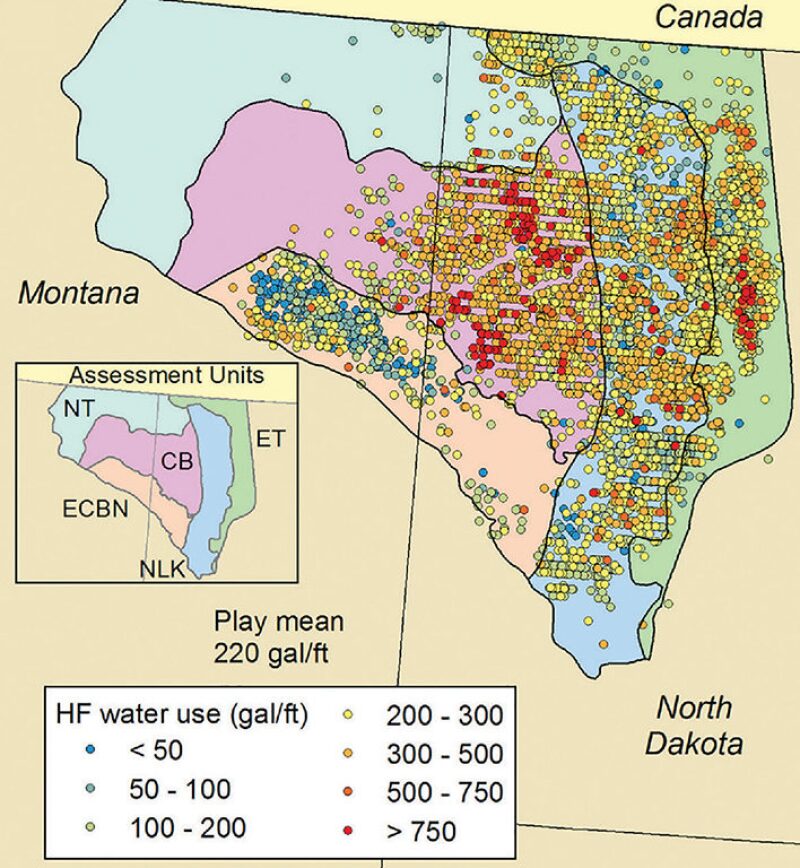
Scanlon et al. (2014) determined that the mean hydraulic fracturing water use in the Bakken was 200 gal/ft of lateral, ranging from 100–320 gal/ft of lateral among the different assessment units. By comparison, in the Eagle Ford mean water usage was 950 gal/ft of lateral, with usage being higher in the western part of the formation (1,020 gal/ft of lateral) than in the east (840 gal/ft of lateral). Scanlon et al. did not compare the regions because the Permian’s multistacked plays and mostly vertical wells make it a significantly different area to measure.
While the mean figures are lower in the Bakken than in the Eagle Ford and the Marcellus, Scanlon said the Bakken saw a significant increase in hydraulic fracturing use starting in 2013, when usage jumped from 310,000 gal/well to 2.8 million gal/well. This increase was partly related to variation in average lateral length, which led to an increase in normalized water use.
“You can say, well, the laterals are getting longer and that’s why we’re using more water. If we divide [water usage] by the length of the laterals and look at the time trend, you see that the water use is increasing,” Scanlon said. “So we’re using more water. Operators say they’re using more slickwater fracs rather than gels, and they probably have more frac stages, so they’re trying to even out the distribution of fracking along the laterals.”
Annually, the state of North Dakota permits withdrawals totaling 10.3 billion gallons of surface water. The US Army Corps of Engineers agreed to a 5-year deal to make available at least 32.5 billion gal/yr of surplus water from Lake Sakakawea in the Missouri River basin via temporary and permanent withdrawal permits (Horner et al. 2016). On top of that, the Western Area Water Supply Project (WAWSP) expanded the supply of potable water from the Missouri River system for municipal, rural, and industrial use in an area near Williston, North Dakota, a central hub of Bakken activity. The WAWSP allows up to 20% of its available water to be used for hydraulic fracturing purposes. However, accessing the water and transporting it to wellsites can be challenging for operators.
Scanlon said the water problems in the Bakken are similar to those in the Permian, namely in that the Bakken is a semi-arid region with high levels of salinity in its produced water—approaching 300,000 mg/L of total dissolved solids (TDS), nearly 10 times the salinity of seawater. Scanlon said the use of fresh water for well maintenance (namely the routine flushing of production casing to remove accumulated salts and prevent scale deposition) skews usage figures for operators in the region.
“The water is so saline that [operators] have to put fresh water down in it to keep it from scaling, and they don’t report that, so we don’t know how much they’re using. Some of the companies we deal with say, well, it could be quite a lot and we’re trying to see how we can manage using a lot of maintenance water. So in some cases we could double the amount of water being used for hydraulic fracturing,” Scanlon said.
Decreasing Fresh Water Use
The high-salinity produced water has forced operators and service companies in the Bakken to develop alternative methods to avoid running high freshwater usage costs. In one such case, Schlumberger developed a crosslinked fracturing fluid that uses 100% produced water from the Three Forks formation. The fluid contains a polysaccharide gelling agent, a pH adjuster, and a proprietary metal crosslinker that it implemented in multistage fracturing for long horizontal wells. The fluid does not require that the water be treated (although operators can remove suspended solids or other potential sources of damage), and it is designed to be tolerant to changes in water quality throughout a typical frac stage.
The first step of implementing the fluid is to hydrate the gelling agent in produced water at a suitable pH to promote fast hydration; typical Bakken downhole conditions require a fluid pH above 10 (SPE 173783). In the second step, a group IV metal crosslinker is added and the pH is adjusted to achieve the optimal crosslinking rate. The resulting fluid is stable at bottomhole static temperature conditions and does not contain any hydroxide or carbonate scales.
McMahon et al. (2015) wrote that one of the benefits of this practice of reusing produced water is that the connate water produced from the well can reach thermodynamic equilibrium with the formation. The water it tested reached equilibrium with the formation it was produced from prior to production and, apart from suspended iron oxides, dissolved solids and hydroxides were found to be in the solution, eliminating the need for a chemical or mechanical method to change the equilibrium. Suspended solids can be removed by filtration, coagulation, and/or settling, and the inherent “fitness” of the water for the formation may be beneficial for operators.
Schlumberger also tested the fluid in a variety of mixwaters with salinity levels ranging from 43,000 to 350,000 ppm of TDS from formations in the Marcellus Shale and the Permian Basin. Identical formulations showed improved performance as the salinity increased.
For Further Reading
SPE 173783 First 100% Reuse of Bakken Produced Water in Hybrid Treatments Using Inexpensive Polysaccharide Gelling Agents by B. McMahon, B. MacKay, and A. Mirakyan, Schlumberger.
Horner, R.M., Harto, C.B., Jackson, R.B., et al. 2016. Water Use and Management in the Bakken Shale Oil Play in North Dakota. Environ. Sci. Technol. (50): 3275–3282.
Scanlon, B.R., Reedy, R.C, and Nicot, J.P. 2014. Comparison of Water Use for Hydraulic Fracturing for Unconventional Oil and Gas versus Conventional Oil. Environ. Sci. Technol. (48): 12386–12393.
Wells, P., Rothbarth, S., and Webb, F. 2017. The Coming Permian Basin Water Disposal Bottleneck. Digital H2O, 27 January 2017 (accessed 25 April 2017).