
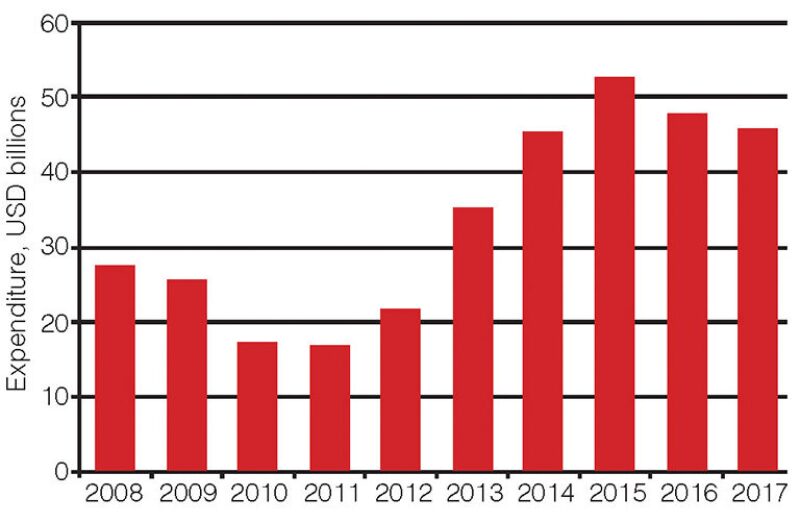
A continuation in the recovery of liquefied natural gas (LNG) expenditure is under way worldwide, driven by a growing demand for natural gas. Douglas-Westwood’s World LNG Market Forecast expects that global capital expenditure (Capex) will total nearly USD 228 billion during the 2013–2017 period (Fig. 1). The surge includes Capex on baseload onshore and offshore fixed LNG liquefaction, LNG carriers, and LNG regasification in onshore and offshore fixed import terminals.
Activity over the next 5 years is underpinned by financial commitments to liquefaction projects and gas import facilities. The liquefaction developments will drive expenditure, with Australasia and North America playing fundamental roles in bringing new supply into the international market.
Spend will peak in 2015 and decline slightly in 2016 and 2017. This is because of the surge of Australian LNG export projects reaching completion. The decline is, however, offset to some extent by significant growth in most other regions, particularly eastern Europe and the former Soviet Union (FSU), Africa, and Asia.
Regional Forecast
Accounting for almost 40% of global expenditure, Australasia is expected to witness an increase of more than 500% in expenditure compared with the 2008–2012 period. This is attributed to the region’s construction activity in liquefaction terminals. A strong reserve base combined with a strategic proximity to high-value demand markets in Asia makes the region an attractive LNG export hub.
Because of the combined expenditure on carrier shipbuilding and import terminal construction activity, Asia will continue to represent one of the largest LNG investment centers. The region will represent 35% of the forecast global Capex.
The North American shale gas boom has led to a shift in the supply and demand balance with the region now aspiring to evolve from a net importer to a net exporter. Douglas-Westwood expects the region to represent 8% of forecast Capex, a 110% increase in expenditure compared with the previous 5-year period. As the third largest investor, the region holds significant potential to become one of the top few exporting regions. However, regulatory approvals will determine the pace of export developments.
The Middle Eastern investment has been in steady decline following the completion of a number of major projects during the 2009–2011 period. Increasing supply constraints resulting from domestic demand pressures lead to a forecast of only USD 1.92 billion (approximately 1%) of total global expenditure in the Middle East from 2013 to 2017.
LNG Market by Facility
Global expenditure on LNG facilities displays an upward trend and is forecast to more than double to USD 227.7 billion. Although all segments display a noticeable increase in expenditure, the wave of new liquefaction projects under construction across Africa, Australasia, eastern Europe and FSU, and North America—coupled with carrier contracts and import developments in Asia—will drive Capex at an overall compound annual growth rate (CAGR) of 7%.
Over the forecast period, total liquefaction Capex will exceed USD 140 billion, more than 60% of total Capex. Import expenditure will represent the second largest proportion of Capex and is expected to increase at a CAGR of 8%. The key factor supporting import investment is expenditure from Asia, which represents more than 80% of all import Capex.
The LNG carrier expenditure is expected to increase to nearly USD 35 billion from 2013 to 2017. The carriers market witnessed a quieter period during the 2009–2012 period because of the global recession, rendering speculative carrier orders economically unviable at the time. However, with growing confidence in the LNG industry and with the wave of liquefaction projects in Australasia and North America, carrier buyers are more inclined to undertake investment.
Liquefaction Terminals
From 2008 to 2012, approximately 90 MTPA of liquefaction capacity was brought on-stream. The forecast period will see more than 100 MTPA come on-stream through 14 new developments and nine expansion projects. Associated Capex in the construction of these terminals (excluding upstream costs, but including all terminal costs such as liquefaction trains, storage, and marine facilities) will equate to more than USD 140 billion.
There will be differences between operator announcements and the forecast startup years because Douglas-Westwood believes that many of the proposed terminals are still in their infancy and have not attained necessary approvals or secured landing sites. Therefore, where appropriate, on-stream years have been adjusted to incorporate these factors to portray a more realistic view of the market.
Capex for the forecast period represents a 181% increase compared with the 2008–2012 period. This is driven by a wave of new liquefaction developments in North America and Australasia resulting from shale gas and coalbed methane developments, in addition to projects in Africa, Asia, and eastern Europe. The Capex forecast has been phased over the construction period and includes expenditure on terminals that are expected to come on-stream from 2018 to 2020.
During the 2008–2012 period, the Middle East represented one-third of expenditure. However, liquefaction expenditure for the region is forecast to significantly decline to less than 1% as domestic demand for gas rises, minimizing export potential.
Because of significant cost escalations in Australasia, the region alone will account for approximately USD 90 billion of expenditure. The continued trend in cost escalation could bring into doubt the viability and future of some Australasian projects, raising the question: Could we see a significant slowdown in Australasian investment?
Because of developments in shale gas drilling technology and the associated rise in production, significant investments extending the capabilities of existing infrastructure in North America will be made throughout the forecast period and beyond. However, the pace of development will be determined by the rate of regulatory approval. The United States’ first export facility (after its Kenai, Alaska, terminal was recently decommissioned) in Sabine Pass, Texas, is due on-stream in 2016.
Eastern Europe will see increased investment in liquefaction with Russia building up its export capacity. Africa will also grow in importance as an exporting region because of developments in Mozambique and Tanzania.
LNG Carrier Market
Over the forecast period, all shipbuilding activities will take place in Asia where the major yards are located. The carrier market will display heavy expenditure throughout the forecast period, increasing by almost 40% over the spending from 2008 to 2012. This is expected to peak in 2016 at approximately USD 8 billion.
During the 2008–2012 period, 121 vessels were delivered, peaking in 2008 at 54 units. Carriers delivered were predominantly Q-max and Q-flex vessels, meeting the requirements of the Qatari fleet.
The effects of the economic recession were reflected in the shipbuilding industry, negatively affecting orders and the associated expenditure levels from 2009 to 2012.
A large surge in deliveries is anticipated because of the onset of liquefaction facilities expected during and beyond the forecast period. Increased confidence in the LNG market will give the LNG carrier-building industry an additional boost.
Pre-2008, some carriers were constructed in western Europe. However, there has been a transition toward Asian shipbuilding because of increased familiarity with Asian-built vessels coupled with lower build costs. South Korean shipyards will account for the majority of newbuilds, while the Chinese group, Hudong-Zhonghua Shipbuilding, will increase its market share from 2013 to 2017.
Given the large number of deliveries anticipated from 2014 onward, yard capacity constraints in Asia may become an issue. Western European shipbuilders may be well placed to take advantage during periods of exceptionally high demand.
LNG Import Terminals
Approximately 250 MTPA were brought on-stream from 2008 to 2012, with the associated Capex totalling USD 32 billion. The next 5 years will see Capex increase, reaching nearly USD 50 billion, as import capacity at levels similar to the 2008–2012 period is brought on-stream.
The previous 5 years saw significant investments in Asia, North America, and western Europe. However, 2011 and 2012 experienced reductions in import investment by North America, because of the possibility of monetizing shale gas reserves at home, reducing its requirement for LNG imports and associated expenditure. Since then, North America has been moving toward LNG import independence.
The increased Capex for import infrastructure in Asia from 2013 to 2017 will represent a 180% rise in expenditure compared with the previous 5-year period.
Comparing the two periods, 2008–2012 and 2013–2017, the demand side of the equation has evolved. As with the previous 5-year period, developing economies in Asia will continue to be the dominant importing region, accounting for more than 80% of import facility expenditure. In addition to established LNG importers Japan and South Korea, top exporters Malaysia and Indonesia will further drive LNG imports as domestic demand dictates a reverse in trade.
Accounting for almost USD 30 billion of the forecast import Capex, the emerging economies of China and India will contribute significantly to import expenditure because of growing domestic gas demand. Likewise, the Philippines, Singapore, and Vietnam are anticipated to substantially increase their investments in import infrastructure during the forecast period.
Latin America’s Capex will rise gradually throughout the forecast period and is attributed to projects in Brazil, Chile, Cuba, Dominican Republic, and Mexico.
A USD 0.4 billion drop in forecast import spend in western Europe reflects the region’s decreased gas demand. In the long term, however, the European gas market should recover as gas-fired power demand returns to prerecession levels.
Conclusions
A forecast of strong growth in global natural gas demand as a fuel for power generation and increasingly as a substitute for oil as a transportation fuel will drive increased expenditure on natural gas facilities worldwide. The discoveries of large reserves are, however, remote from the end users.
The geographic disconnect results in regional gas price differences and potential for arbitrage. One example is the United States with natural gas at USD 3/Mcf compared with USD 9/Mcf in Europe and more than USD 16/Mcf in Japan. Liquefaction enables these reserves to be brought to market.
Areas in Asia, Latin America, and the Middle East are seeing growing gas demand, and LNG is seen as a solution to seasonal demand spikes. Other areas, such as the United Kingdom, are seeing a severe fall in gas production and are importing increasing amounts of LNG.
A growing environmental awareness is also an important factor in the increasing use of natural gas. With natural gas only emitting half of the greenhouse gases of coal, it provides a mechanism for rapidly reducing emissions.
The European Union’s emissions act in 2015 and the potential for price arbitrage, may offer incentives to shipowners to use LNG as an alternative fuel. LNG is also being increasingly adopted in many countries for road applications, such as buses and trucks.
Unconventional gas, such as shale gas and coalbed methane, will be a feedstock and competing source of natural gas. Depending on its geographic location, it is also a candidate for liquefaction.
Successful production of unconventional gas may enable the US to become a net exporter within the forecast period. However, regulatory approvals have been hard to obtain and have impeded the development process.
US natural gas prices are expected to increase as the full cycle costs of shale gas production are at least USD 7 to USD 8/MMBtu. Elsewhere in the world, the full cycle costs are yet to be understood, but are likely to be higher than the US’. LNG from conventional gas plays can, therefore, be cost-competitive with shale gas.
In most regions, natural gas prices are strongly discounted, compared with oil on a Btu parity basis. This suggests potential for increases in natural gas prices over time as the ease of trade and arbitrage increases.
The focus areas for LNG export projects are expected to continue changing. While the Middle East remains one of the top exporters, the region will see little expenditure within the forecast period. Australian spend, however, will surge, peak, and start to decline.
As in many other sectors of the oil and gas industry, reducing the costs of LNG projects remains a major challenge. Beyond 2017, a significant potential for major growth in LNG capital expenditure can be seen, because of the large discoveries in east Africa and the eastern Mediterranean region, together with an increased focus on exports of US shale gas.