
Before the global economic downturn crashed the energy industry, the liquefied natural gas (LNG) market was prospering across the entire value chain, according to a recent report issued by the International Gas Union (IGU).
Last year record low gas prices driven by increasing natural gas production, new export terminals, and weak Asian demand, resulted in the LNG industry’s sixth consecutive year of growth.
That is, until the bottom fell out on global LNG benchmark prices due to oversupply brought on by COVID-19, starting in March 2020.
And while the report depicted a flourishing industry poised for continued growth, it must be read from the perspective of today’s dismal downturn, just a few months after the rosy picture was painted.
So what’s a producer to do?
Research group Rystad Energy said that with relatively little arbitrage between feed-gas prices and their target customers’ benchmarks, it appears the most economic option for them will be to ramp down production.
“Shutting a terminal would be considered the absolute last resort for a cash-strapped LNG producer, and is a move that would only be undertaken if prices were not expected to become profitable for a long period,” Rystad said in its analysis. “The obvious drawback of restarting an LNG plant is that the commissioning of the facility is highly complex.”
According to Rystad, those best positioned to reduce volumes while suffering the least possible financial damage are Asia-Pacific (APAC) terminals, specifically the eastern Australia projects and North West Shelf (NWS) LNG, plus some US plants that have been operational for a longer period of time such as Sabine Pass LNG and Cove Point LNG.
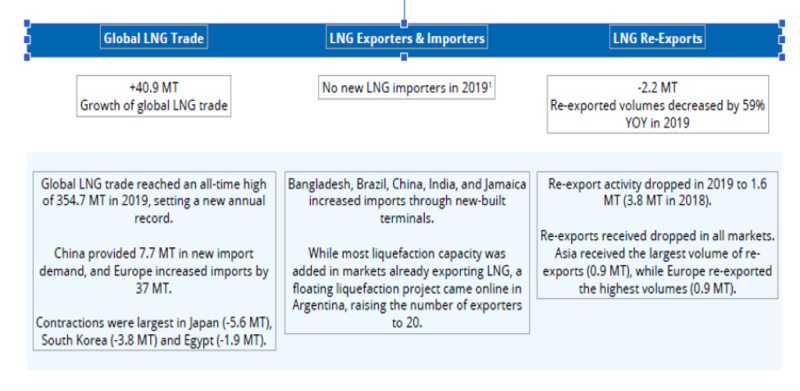
IGU said trade increased by 40.9 million tonnes (mt) (13%) to 354.7 mt, coming on the back of increased exports from the US, Russia, Australia, Algeria, and Egypt. This came as the largest change in imports was observed in Europe, where the UK, France, Spain, the Netherlands, Italy, and Belgium together imported 32 mt more than in 2018.
Looking at the state of the LNG industry, IGU data show most of the additional exported volumes in 2019 were from existing exporting markets: from the US (+13.1 mt), Australia (+8.7 mt), and Russia (+11 mt).
Imports and Exports Mostly Up In 2019
Qatar remains the largest exporter in the world (at 77.8 mt), followed by Australia (75.4 mt), the US (33.8 mt), Russia (29.3 mt), and Malaysia (26.2 mt).
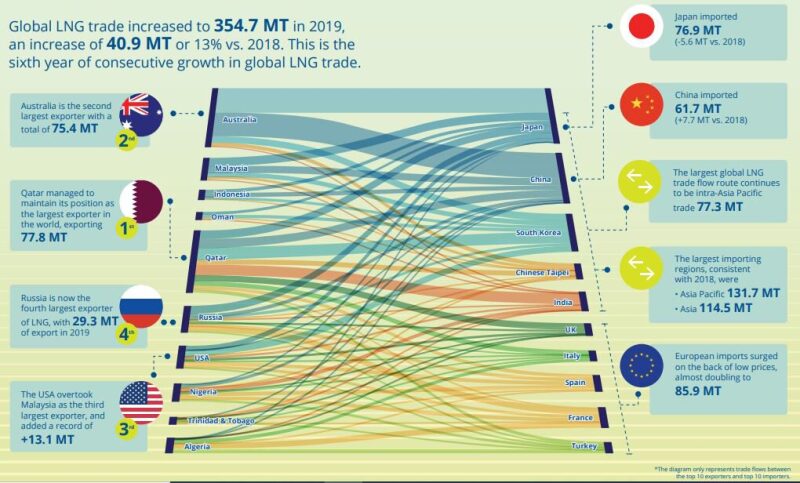
Meanwhile, Asia Pacific continued its growth trajectory as the largest export region (131.7 mt).
Only three markets saw export levels down from 2018: Indonesia (-2.7 mt), Equatorial Guinea (-0.65 mt), and Norway (-0.45 mt).
With exports mostly higher, so too were import levels. The largest importing regions, consistent with 2018, were Asia Pacific (131.7 mt) and Asia (114.5 mt), where China, India, and Malaysia also contributed to global trade.
The largest increases in imports, however, were seen in Europe with UK, France, Spain, the Netherlands, Italy, and Belgium, which together accounted for most of the additional imports (+32 mt). Recent importing countries such as a Bangladesh, Pakistan, Poland, and Panama also saw imports increase in 2019.
The increase in trade volumes came alongside higher liquefaction capacity as well.
Liquefaction Capacity Up Significantly
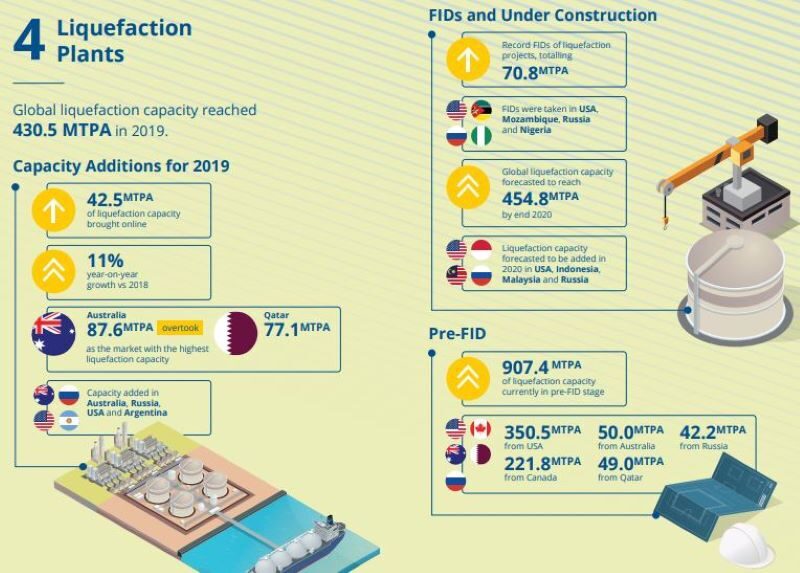
Global liquefaction capacity additions in 2019 totaled 42.5 mtpa. Leading the way was Ichthys LNG T1-2 (8.9 mtpa) and Yamal LNG T3 (5.5 mtpa), both commissioned in late 2018 and starting commercial deliveries in 2019. Corpus Christi LNG T1-2 (9 mtpa), Cameron LNG T1 (4 mtpa), Freeport LNG T1 (5.1 mtpa), Sabine Pass T5 (4.5 mtpa), and Elba Island T1-3 (0.75 mtpa) also began commercial operations in 2019, contributing to more than half of the capacity additions.
Floating liquefied natural gas (FLNG) developments also contributed, with Prelude FLNG (3.6 mtpa) and Tango FLNG (0.5 mtpa) commencing commercial exports in June 2019.
As of December 2019, there was 123.3 mtpa of liquefaction capacity was under construction or sanctioned for development. For this year, 24.35 mtpa out of that 123.3 mtpa capacity under construction is expected to come online.
Sanctioned liquefaction capacity also grew in 2019, totaling 70.8 mtpa, with final investment decisions (FID) driven by expected growth demand. Currently, there is 907.4 mtpa of liquefaction capacity in pre- FID stage, with the majority coming from the US and Canada.
Africa is poised to emerged as a key LNG producer with 93.3 mtpa of proposed liquefaction capacity. In the Middle East, Qatar’s LNG expansion plan is moving towards FID, which could re-position Qatar as the market with the largest liquefaction capacity globally.
The IGU said the record volume of sanctioned liquefaction projects was underpinned by the expectation of growing LNG demand globally, creating the need for additional liquefaction capacity. The union added this would lead to competition to secure engineering, procurement, and construction (EPC) capacity, as project developers get into the market by the mid-2020s in order to capture growing demand.
Regasification Capacity Up Second Consecutive Year
With a total regasification capacity expansion of 23.4 mtpa, 2019 marked the second consecutive year in which regasification capacity additions were outpaced by increases in liquefaction capacity. Six new terminals began importing LNG cargoes in 2019, while expansion projects at three existing terminals were completed.
A large portion of regasification capacity additions were in Asia and Asia Pacific regions, accounting for 14.2 mtpa in receiving capabilities, reflecting the region’s demand growth. India added the most regasification capacity at 7.5 mtpa.
Regasification capacity is on track to continue growing in 2020. By February 2020, global regasification grew to 821 mtpa as of February 2020, with 37 markets equipped with LNG receiving capabilities, and 120.4 mtpa of regasification capacity under construction. This includes 14 new onshore terminals, 12 floating storage and regasification units (FSRUs), and seven expansion projects at existing receiving terminals.
IGU said by year-end 2020, 47.1 mtpa of regasification capacity is set to come online and could include new importers such as Ghana.
Meanwhile, regasification capacity at operational offshore terminals increased by 13 mtpa in 2019 through the construction of three newbuilt floating terminals at ports in Brazil (Sergipe), Jamaica (Old Harbour), and Bangladesh (Moheshkhali (Summit)) as well as the chartering of a replacement floating storage regasification units (FSRUs) with larger receiving capabilities in an existing market—Turkey (Etkinlik). Kuwait’s Mina Al-Ahmadi terminal also signed a new 2-year charter contract beginning March 2020 with its existing FSRU—Golar Igloo, after its first charter contract concluded at the end of 2019.
By early 2020, IGU said offshore regasification capacity at 24 operational terminals rose to 101.2 mtpa; as of February 2020, 12 offshore terminals, with a total 36.6 mtpa of regasification capacity, were under construction.
Another eight terminals were expected to come online by end of 2020, including new importers such as Ghana.
El Salvador, Croatia, and Cyprus are among other countries expected to add regasification terminals through offshore facilities beyond 2020.
Some markets are expanding their floating regasification capabilities too. India is a prime example highlighted by IGU, which is anticipated to commission its first FSRU-based terminal early this year, equipping India with both onshore and floating regasification terminals.
As of February 2020, there were about 10 FSRUs (including conversions) on the order book of shipbuilding yards.
This all comes as the global LNG fleet sees continued growth. The global LNG fleet consisted of 541 active vessels at the end of 2019, including 34 FSRUs and four floating storage units (FSUs).
The global LNG fleet grew alongside trading volumes and capacity as well, moving up 8.4% year-on-year (YoY) in 2019, with 42 new vessels, out of which 3 were FSRUs . By comparison, annual growth of LNG trade in 2019 stands at 13%, which IGU said shows a good balance between growth in the LNG shipping market and LNG trade.
As the global market grows in most key areas and remains poised for further growth, key questions remain.
Looking Ahead
The IGU addressed several issues for the LNG industry in the years ahead, ranging from developments in Europe and Asia, supply and demand, project development, market barriers, and emissions.
The group noted that traditional barriers including project siting limitations, environmental and domestic land use requirements and opportunity costs, investment qualification and availability deficiencies, and policy uncertainties and instabilities will continue to exert pressure against LNG development among prospective importers.
Also, institutional risk factors, even among feasible projects, may play a major role as barriers to projects, especially up to the FID.
Regarding FIDs, IGU added that the continued evolution of the LNG market, with more liquidity, may incentivize use of broader portfolio approaches, incorporating the flexibility of short-term and spot markets to allow for arbitrage and hedging as energy prices change.
Most importantly, the IGU said global disruptions may play important roles in short-term, and eventually long-term, trade activities. But, increasing LNG market liquidity and trade flexibility may lead to reduced short-term risks of such disturbances. Other risks are less visible and may result in regionalized impacts.
Different lengths of cycles in the LNG industry are also key, since capacity gets added years after sanctioning.
“A key disruptive event during a sanctioning wave could dampen investment appetite and drive an earlier-than-expected supply-and-demand gap as less export capacity gets added than was required,” wrote IGU. “On the other hand, a disruptive event during a period of buildout and oversupply could trigger concerns over security of supply, driving more long-term contracting and ultimately potentially leading to continued oversupply.”
The complete IGU publication may be accessed here: 2020 LNG report