This column is a book review and commentary on The Price of Oil by Roberto Aguilera and Marian Radetzki. I highly recommend this book and the article they authored, “Climate Policy With Low Oil Prices,” in the February issue of JPT.
Aguilera and Radetzki predict a dramatic increase in shale oil and other tight oil production from about 4 million BOPD today to as much as 40 million in 2035. This incredible increase would set the market price in 2035 at the shale oil price, which they predict will then be between USD 40/bbl and USD 60/bbl.
The Reason for the Boom
Oil is a commodity and its price varies with market forces as do all other commodities. But oil is different in that the value of oil produced is an order of magnitude greater than any other commodity (4.8% of the global gross domestic product [GDP] in 2013). And the price swings are more dramatic than for any other commodity.
In their book, Aguilera and Radetzki address the price drivers that create this dynamic situation.
Because oil is difficult to replace in the short or medium term, the major demand sources are not much affected by price swings; hence a small shortage of oil can result in a large price increase. But over time, the world has been weaning itself from oil as shown by the rate of oil consumption as a function of GDP:
- In 1973, we consumed 1,185 bbl of oil per USD million of global GDP.
- In 2013, we consumed only 560 bbl of oil per USD million of global GDP.
Several possible sources of the volatility of oil are investigated by Aguilera and Radetzki. They conclude that the recent high prices were caused by supply limitations, which were caused largely by the ineffectiveness of state-owned oil companies. Whereas private oil companies are in business to produce oil and make a profit, state-owned oil companies are often forced to pursue more complex and diverse goals. These goals include social responsibility items such as employment, skill creation, foreign exchange generation, infrastructure development projects, etc. The top managers are often political appointees with little or no oil industry experience. And governments often overtax the companies, leaving inadequate funding to increase or even maintain production rates.
The Advent of Shale
High oil prices, whatever the cause, led to the development of shale gas and oil. Two existing technologies are combined for the production of the resources: horizontal drilling and hydraulic fracturing. The shale revolution started in the US about a decade ago—first gas and then oil.
The results have been phenomenal. Oil production in the US increased from 5 million BOPD in 2008 to 8.6 million BOPD in 2014, after 4 decades of steady decline from a peak of 9.6 million BOPD in 1970.
How Long Will It Last?
The US Energy Information Administration (EIA) and the International Energy Agency both predicted in 2014 that shale oil production will peak in 2020 at about 5 million BOPD and steadily decline after that. Their pessimism is driven by:
- Resource availability (the best prospects have been drilled and others will be less productive)
- Above-ground nontechnical issues, including community opposition
The authors disagree with this pessimism, citing a history of pessimistic predictions about shale production in the past that have proved untrue, the relative lack of appraisal of many potential areas, and the remarkable technical innovation that is likely to continue. Recent innovations include:
- Pad drilling
- Increases in the number of fracturing stages
- Refracturing
- Zipper fracturing
- Fracturing with alternative fluids, including natural gas liquids
- Increasing adoption of techniques developed for shale plays in other tight oil reservoirs
Why the Shale Revolution Started in the US
The shale revolution began in the US and has been largely limited to the US so far. Among the reasons are the following:
- Existing resource plays
- The technological prominence of US companies
- Availability of existing infrastructure from conventional plays
- The entrepreneurial spirit in small oil companies that lead the way
- Reduced environmental sensitivities as a result of sparse populations and a history of oil production
- Landowners owning the mineral rights and having an incentive to support oil developments
Will It Spread to the Rest of the World?
Aguilera and Radetzki clearly think that it will. Though the size of the shale resources around the world are poorly understood, the estimate is trending upward: EIA’s estimation of global recoverable shale oil reserves went up from 32 billion bbl in 2011 to 345 billion bbl in 2013.
And the authors believe that the number still underestimates the reserves. By applying a technique called the variable shape distribution model to estimate the reserves in basins not yet explored, they estimated recoverable shale reserves of 650 billion bbl.
It seems likely that the shale revolution will spread to other countries, though the spread will be uneven and will take time. The authors predict that by 2035 shale oil production could be as high as 20 million BOPD. Further, they speculate that the technologies developed for shale exploitation will be applied to other tight oil plays generating another 20 million BOPD.
The Effect on and of Oil Price
The shale revolution was enabled by the high oil prices of the past few years that made initial forays into shale worth the risk. Rapid innovation has driven and presumably will continue to drive down the cost of shale oil. The production volumes predicted earlier in the article depend on continued decreases in production costs.
Altogether, this spells significant downward pressure on oil prices in the long term. Because the revolution will take time to play out, its effects in the short term are more muted. Oil prices may continue to fluctuate significantly in the short and medium term.
Short- and Long-Run Predictions
The long-run situation is shown in Fig. 1. The two supply curves reflect different assumptions on the cost of marginal (expensive) barrels. The rationale for the shape of the curves is that there is not much oil left to be developed at a low price, but there is a great deal of oil that can be exploited once some threshold price is reached, so the curve flattens out.

The cost to extract the marginal oil barrels sets the price for all barrels. Obviously, if there is a large future source of oil that can be had at a lower-than-expected price, that sets the future expectations. Aguilera and Radetzki predict that shale oil will be profitable at USD 40/bbl to USD 60/bbl (today’s dollars) in 2035, which will set the market price.
But the future price of oil is an abstraction. It assumes that we will drill enough wells to meet short-run demand, but not exceed it by too much. The price of oil is set today (and every future day) by a different supply and demand curve. The short-run supply, of course, contains only the current capacity to produce. The short run is defined as the period of time whose briefness does not allow additional production capacity to be installed.
In the short run, the price is determined by supply and demand (Fig. 2). Note that the curves meet, but do not cross (Aguilera and Radetzki do not show it this way). Oil supply and demand are in balance. Whereas the long-run supply curve in Fig. 1 included all costs including capital cost and profit, we should consider the supply curve in Fig. 2 to be variable costs (salaries, maintenance, transportation, debt servicing, etc.). In an environment represented by Fig. 2, almost everyone is making money, but the marginal barrels may be sold at lifting or variable cost.

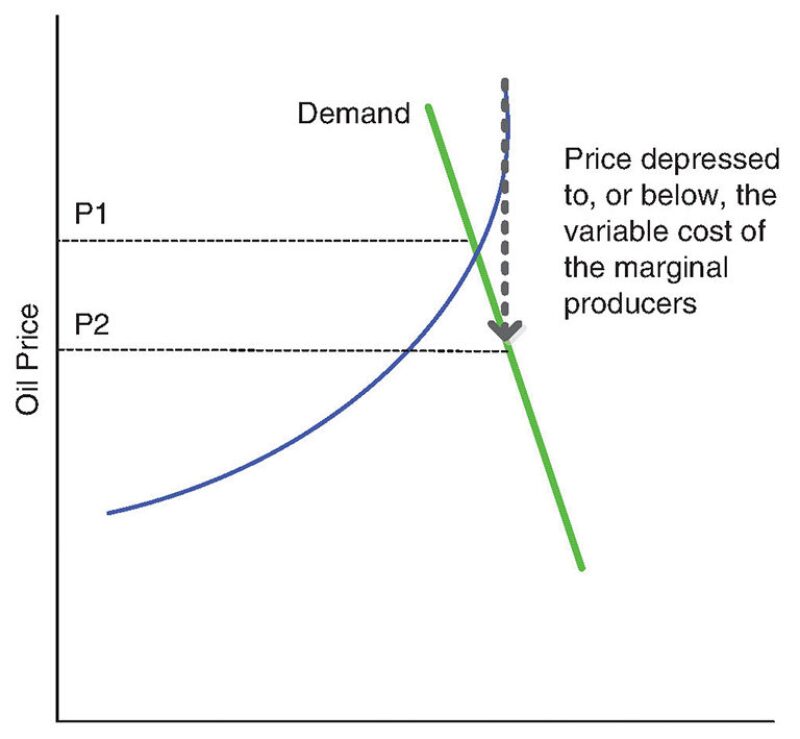
Fig. 3 represents the current supply glut. In this case, the price is suppressed until the supply and demand are in balance or nearly in balance as shown in Fig. 4. We do not ever need perfect balance. A large amount of storage exists in the world, so much of the surplus oil can be put into storage for a while.

Commentary
The Price of Oil is much more interesting for what it says about long-term prices than what it says about the short term. If Aguilera and Radetzki are even remotely correct in their predictions, the oil industry in 2035 will be a much different place than it is today.
As I write this, several major oil-producing states are meeting to discuss supply curtailments, or at least the curtailing of supply growth. This will surely have significant impact in the short and perhaps medium term.
EIA (2016) currently predicts oil supply and demand coming into balance around the middle of 2017. If OPEC freezes production at current levels, the balance might occur this year.
Perhaps the end is near. While we all hope that the next boom is near, let us also hope that we will not forget what we have learned during this bust.
For Further Reading
Aguilera, R.F. and Radetzki, M. 2015. The Price of Oil. Cambridge University Press.
Aguilera, R.F. and Radetzki, M. 2016. Climate Policy With Low Oil Prices. J Pet Technol 68 (2): 16–18.
US Energy Information Administration. 2016. Short-Term Energy Outlook: Global Petroleum and Other Liquids, https://www.eia.gov/forecasts/steo/report/global_oil.cfm (accessed 22 February 2016).
Howard Duhon is the systems engineering manager at GATE and the SPE technical director of Projects, Facilities, and Construction. He is a member of the Editorial Board of Oil and Gas Facilities. He may be reached at hduhon@gateinc.com.