Demand for oil and gas continues to steadily grow as global population centers shift and expand. Production of hydrocarbons is increasing too, but not necessarily in or near the regions that will need the most energy in the coming years.
A report from the International Association of Oil & Gas Producers (IOGP) explores the global production-demand mix in seven regions, using a production indicator (PI) metric that determines the level at which a region is able to meet its own oil or gas demand. The PI is based on dividing production by demand: A PI higher than 100% means the region produces more than it needs to meet its own requirements and can export.
Data from IOGP’s Global Production Report shows the regions fall into three distinct groups when it comes to supply-demand balance: Europe and Asia Pacific as net importers; Central and South America and North America as self-sufficient areas; and Africa, the Commonwealth of Independent States (CIS), and the Middle-East as net exporters.
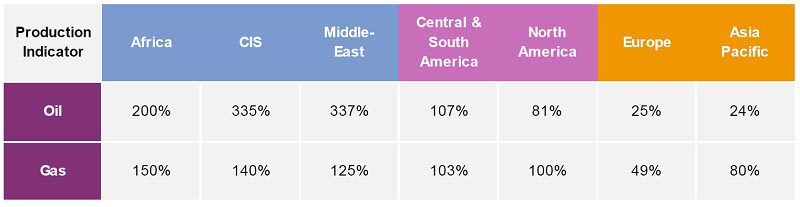
Rising demand for gas in particular could turn a couple exporting regions into net importers in the coming years. Africa’s PI for gas fell to 150% from 215% during 2006–2016, meaning it could become a net importer by 2030. Production flatlined over the decade while gas demand rose 50%. Egypt has bolstered demand for both oil and gas in recent years.
Africa’s PI for oil dropped to 200% from 344% during 2006–2016, according to the report, though it can still export about half of its production of 8 million B/D. Nigeria remains the top producer while previously prolific Libya’s output is almost nonexistent. Meanwhile, regional oil demand has increased by a factor of seven since 1965.
Asia Pacific’s oil PI declined during 2006–2016 to 24%, its lowest point ever, meaning three quarters of the region’s oil must come from abroad. More than 35% of global oil is sent to the region, driven by Chinese demand. Regional production stalled over the decade at around 8 million B/D, half of which came from China.
Asia Pacific has to import about a fifth of its gas, with a PI of 80%. The region, however, increased its gas production by 4.1%/year during 2006–2016.
In the nearby CIS—or Russian Commonwealth—the production-demand picture looks quite different. With an oil PI of 335%, the region produced more than three times its demand during 2006–2016. As a result, its export potential is 235%, or about 10 million B/D. While production remains high, the region’s demand has declined since the dissolution of the Soviet Union. This has particularly been the case in Russia, where demand halved from 5 million B/D in 2002.
The CIS region is the world’s largest gas exporter with the ability to ship more than 200 billion cu m/year. The CIS PI for gas grew steadily over the three decades to 140%. Gas demand, like that of oil, has been in steady decline.
A large consumer of Russian gas, Europe has to import about half of its gas for consumption. However, demand is rebounding and production has remained stable in recent years. IOGP notes that the continent benefits from a world-class import infrastructure and a well-developed internal energy market framework.
Although Europe’s oil PI was a mere 25% in 2016, that number was up from 10% in the 1960s, bolstered by the UK’s and Norway’s development of the North Sea. Production from those aging fields, however, will need to be replaced. Europe produces around 3 million B/D of oil, and demand has hovered at 14–16 million B/D since the 1970s.
The Middle East’s role as a primary supplier of world oil promises to continue. The region in 2016 produced 35% of the world’s oil at an all-time high of 32 million B/D, with a PI of 337%. Regional demand, small relative to production, is growing in Saudi Arabia, Qatar, and UAE.
The Middle East’s gas PI was 125% in 2016, covering all of its domestic demand and then some. Gas production grew by 7%/year during 2005–2015, giving the regional an 18% share of world production. Qatar is currently the world’s largest LNG exporter.
North America’s oil PI was 81% in 2016, up from 55% in just 8 years, with output surging thanks to the shale boom. The US, the region’s largest producer, had a PI of 63%, up 33% over the previous decade, while it consumed 82% of the region’s demand. It’s a similar story with gas, which had a PI of 100% thanks to shale formations in both the US and Canada.
South America is becoming a net exporter of oil with a PI of 107% as Brazilian growth—along with Venezuela’s decline—has made it the continent’s largest producer, notching a 35% regional share in 2016. Brazil also has accounted for the largest share of demand in Central and South America, while Venezuela’s economic crisis has shrunk its demand.
A steady rise in South America gas demand has been met by several rising producers, namely Bolivia, Brazil, Colombia, and Peru, which have joined mainstays Argentina, Venezuela, and Trinidad & Tobago. Regional demand for gas in Central and South America has increased by a factor of 12 since 1970 on the backs of Argentina, Brazil, and Venezuela.