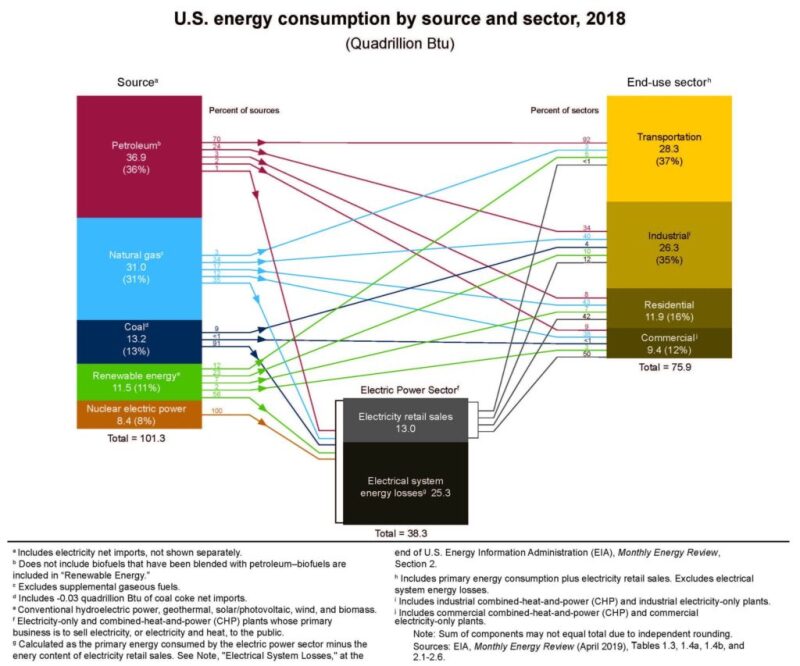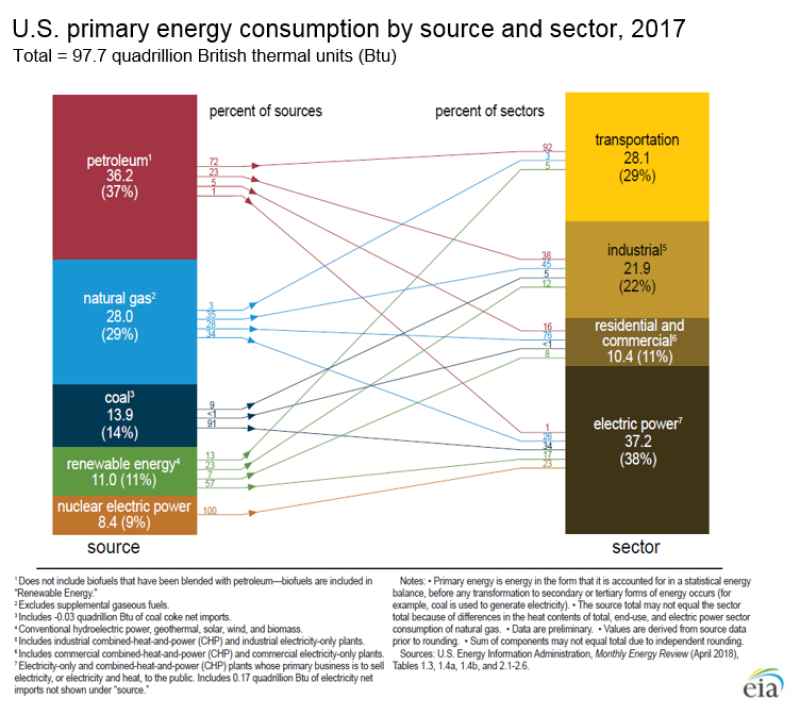
The EIA chart tracks the various sources of energy production in the US for the year 2018 to its end-use sectors. The chart shows 100% of energy produced using nuclear power going to the electrical sector, 70% of petroleum sources fueling transportation, 91% of energy from coal and 56% of renewables powering the electric power section, and 25.3% of the energy being lost in electrical systems. The 2017 US Consumption is provided in the second chart for comparison.